The disaggregation range feature in TolaData allows users to set up specific range values within their disaggregation types so that data pulled from a data table will automatically be disaggregated into its corresponding range. Default ranges and mandatory ranges can be set by the project admin to be used across specific indicators in projects.
Creating Disaggregation Ranges
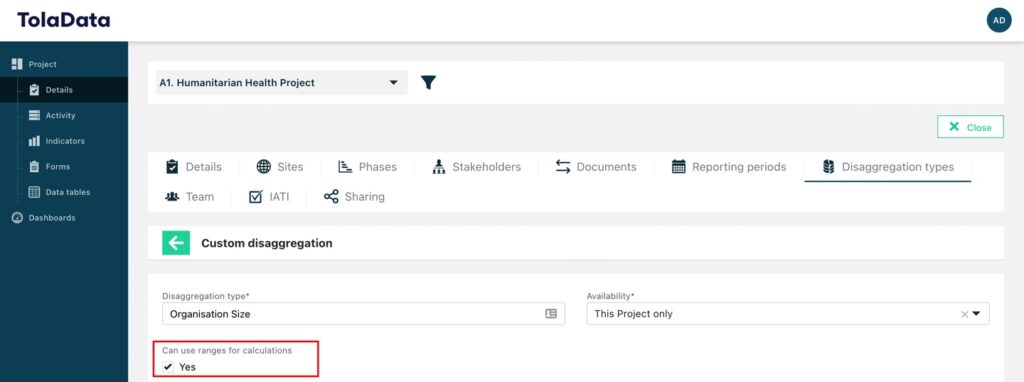
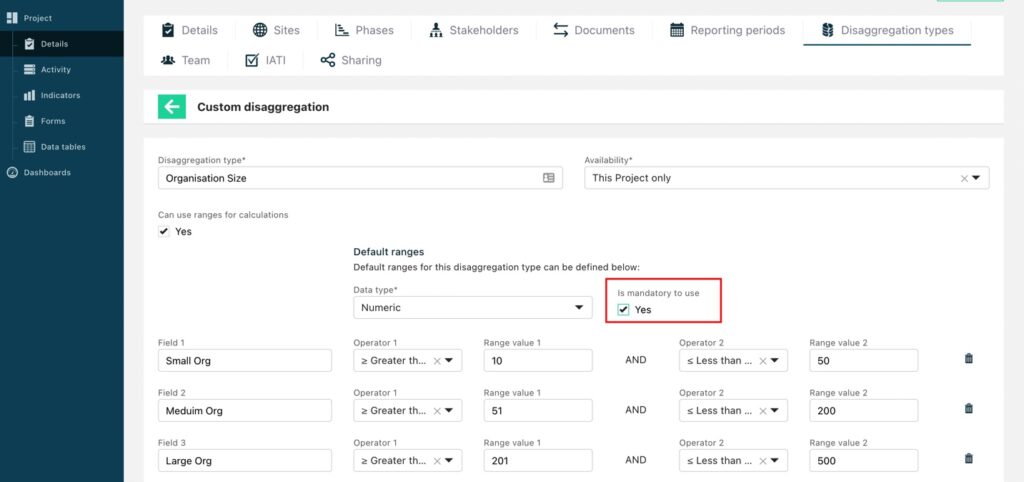
To create a disaggregation with a specified range, navigate to the disaggregation types tab in the project details section. Begin creating your disaggregation as standard in TolaData, by adding the disaggregation type name and selecting the availability. To use ranges, select the check box marked ‘can use ranges for calculations’
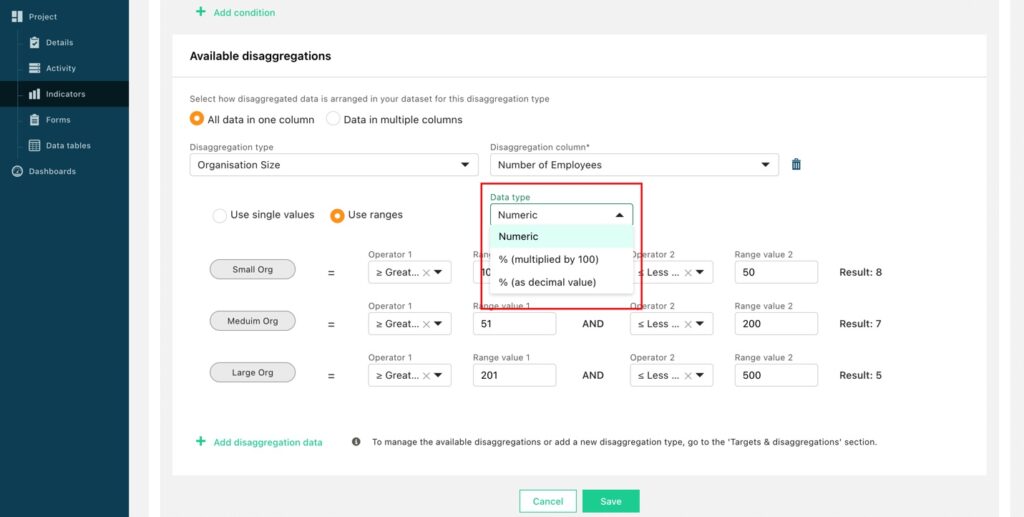
A new field will appear allowing you to add a set of ranges to the disaggregation. To begin, set the data type of your disaggregation. This is the format you expect the disaggregation column in the data tables to be displayed in. You can set the data type to be numeric, % (multiplied by 100) as % (as decimal value).
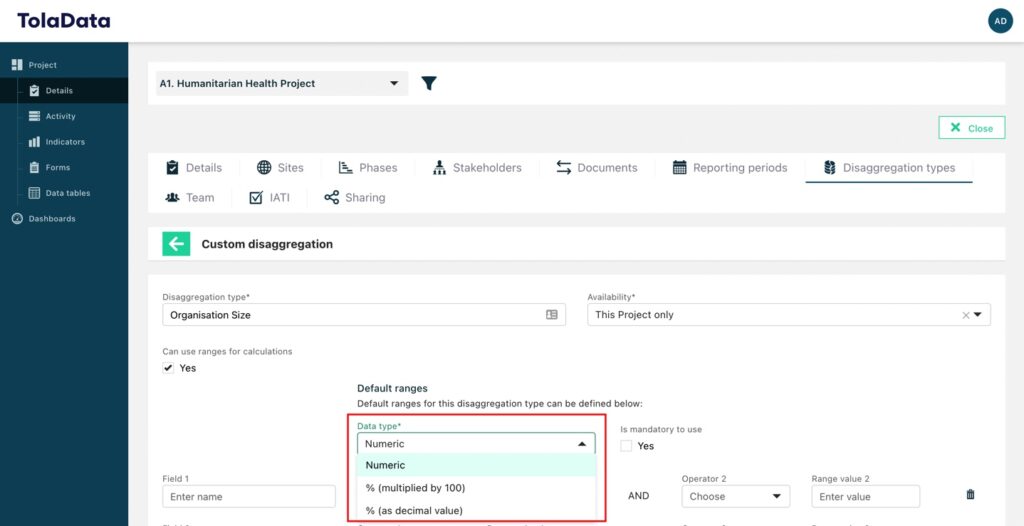
You can also make the disaggregation range mandatory to use, this will be explained later in this article.
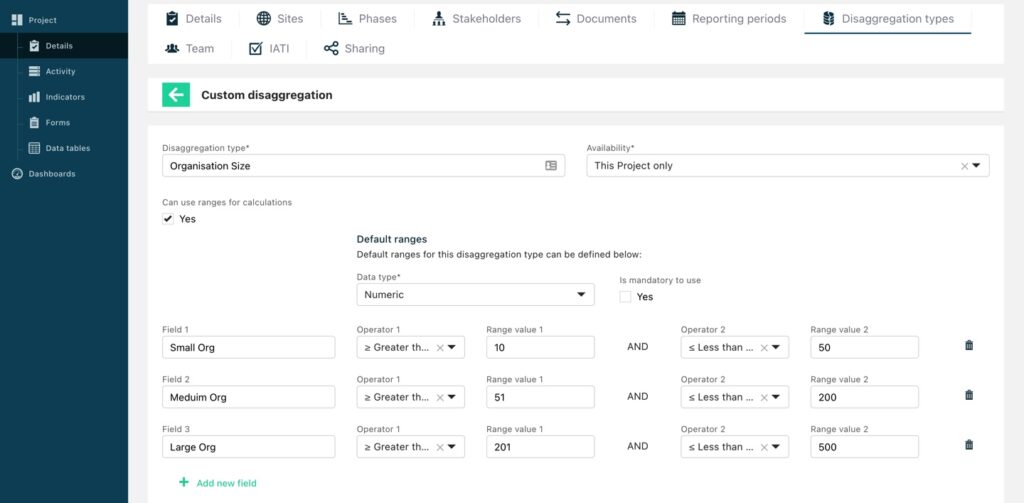
Once this basic information has been added we can add our disaggregation values. In this use case, let us categories the size of an organisation into small, medium and large. Begin by naming the field and then adding the range with the corresponding operator. Once you have added all relevant fields, select save.
< 10 : all the values less than 10
>10 & <20: all the values greater than 10 and less than 20
>=10: all the values greater than or equal to 10
Using the Disaggregation Range with an Imported Data Set
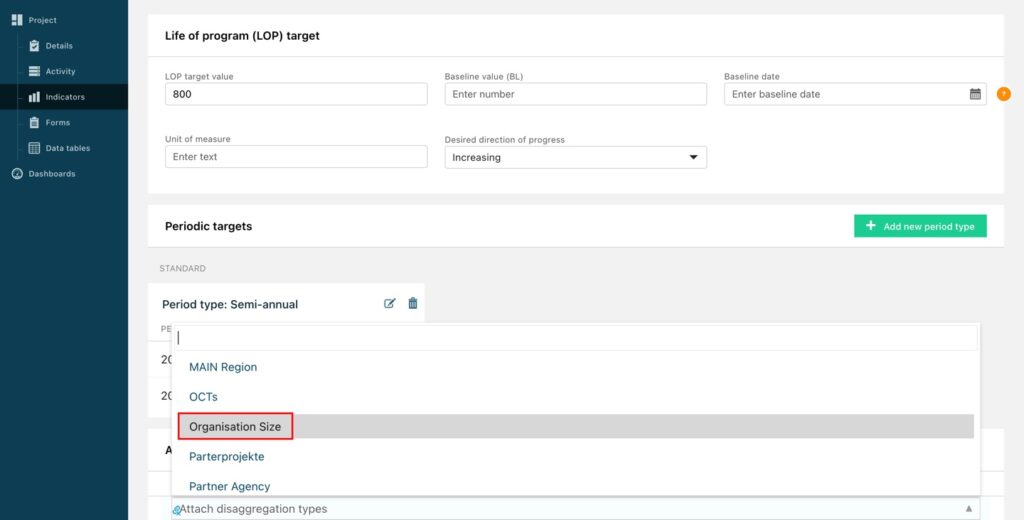
To use your newly created disaggregation range, you must first link the disaggregation to your indicator. To do this, navigate to your indicator and open the ‘Targets and Disaggregations’ tab. Select ‘Attach disaggregation types’ and find your newly created disaggregation in the dropdown.
Select ‘Save’ and navigate to the Collected data tab. To interact with a data table, ensure you have uploaded a dataset into TolaData. You can find out more information on importing a data set and linking this imported data to an indicator here. Follow the usual steps by selecting:
· The collection date
· The data table
· The data column
· The calculation formula
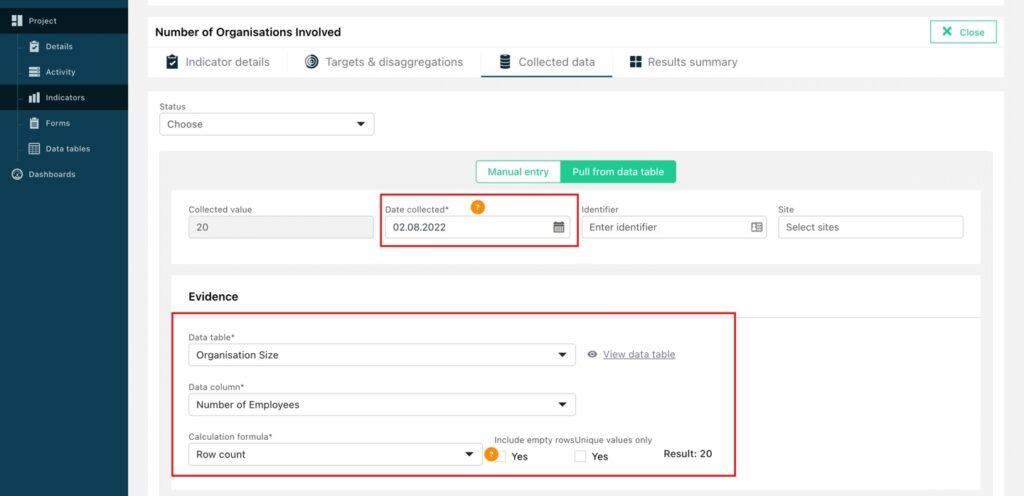
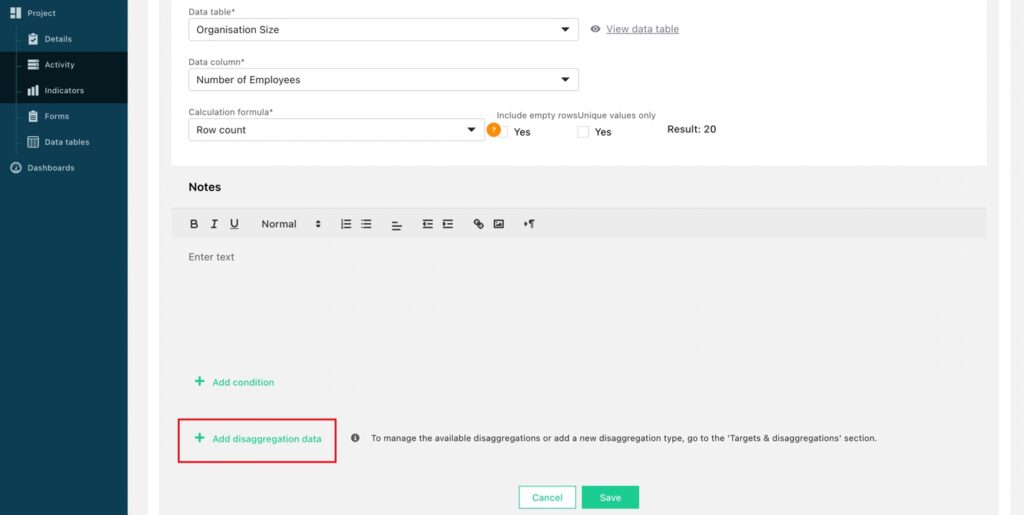
Once you have added the basic information, select the ‘Add disaggregation data’ button.
First, select how disaggregated data is arranged in your dataset for the disaggregation type. Disaggregations can be contained in one single column or in multiple columns. Next, select the disaggregation type which you would like to use. All linked disaggregation types related to this indicator will appear in this dropdown. Lastly, select the column(s) in which your disaggregation is contained.
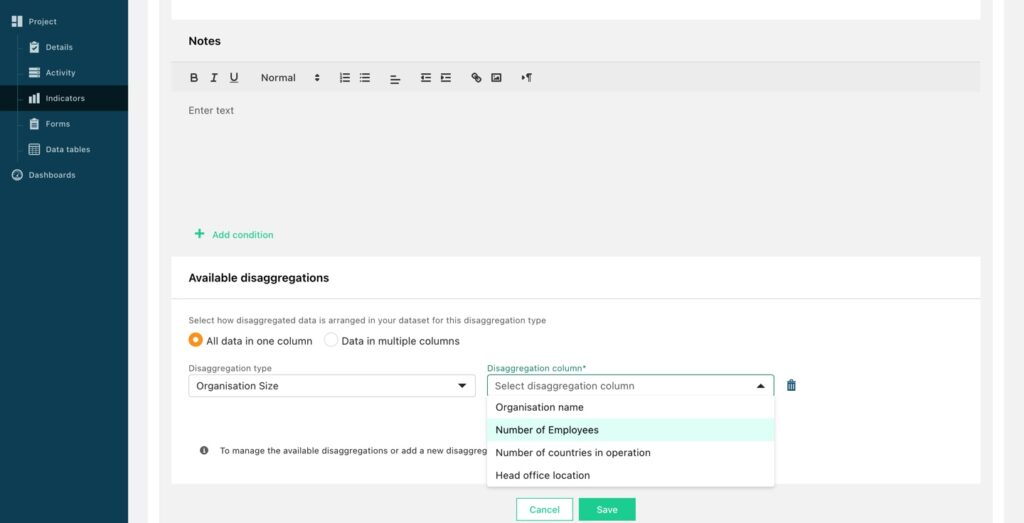
After selecting your disaggregation column, the data contained in this column will automatically fall into the specified disaggregation range.
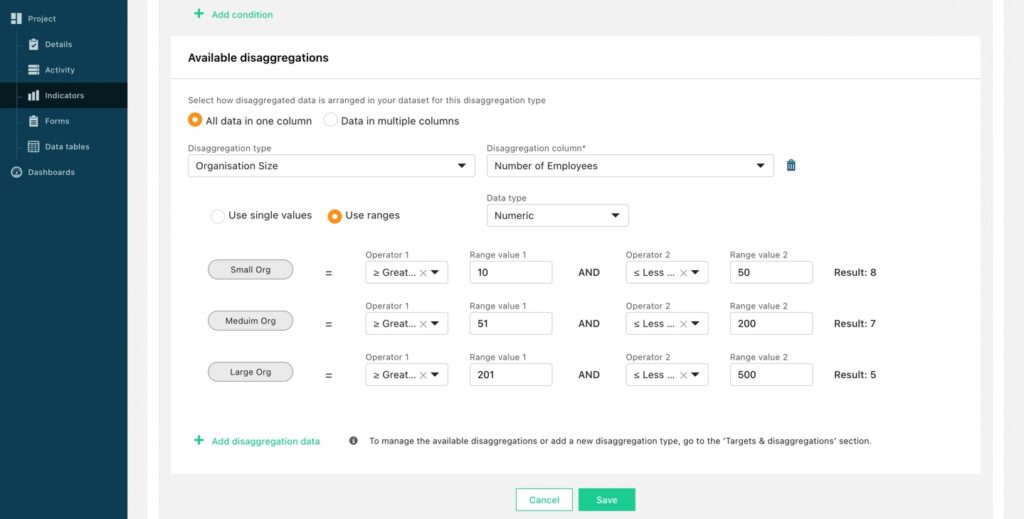
You can also choose to manipulate the data type here or, revert back to single values if needed.
Once you finished, select ‘Save’.
Creating a Mandatory Disaggregation Range
You can also set the range to be mandatory to use. To make a mandatory disaggregation range, select the check box ‘Is mandatory to use’ when you are creating the disaggregation range.
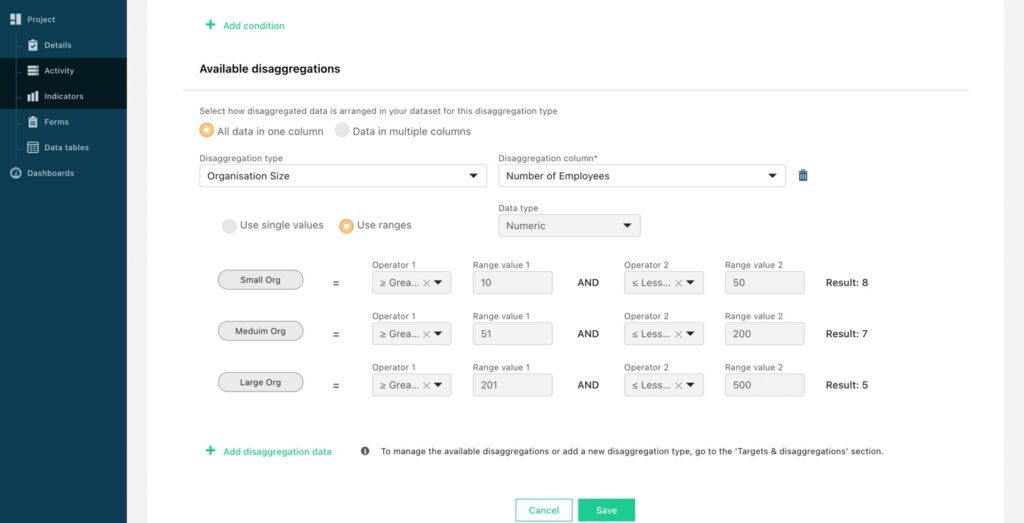
When a disaggregation range is mandatory, the user pulling from the data table will have to use these default ranges and cannot enter single values when calculating the disaggregation result or set their own disaggregation range. The image below shows an example of how these configurable options are greyed out when a disaggregation range has been marked as mandatory to use.
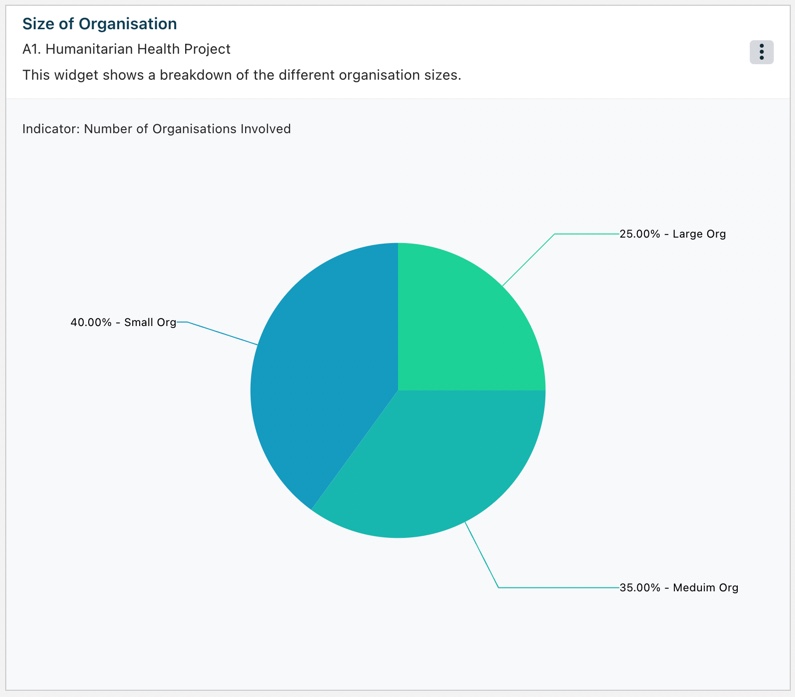
As with all disaggregation types in TolaData, once you have added some data you can begin to create charts to visualize your results in the Dashboard section. To find out more about building your widgets in the dashboard section, select here.