After you open your dashboard, click ‘+ Add new widget’. A widget pop-up window will appear where you can add a title for your widget and select the type of widget you want to create: ‘Text & image’, ‘Project indicators’, ‘Budget data’ or ‘GIS map’. When you create a widget it will automatically open.
Tip: to get started quickly, use Build with AI on the dashboard’s widgets tab to generate a first draft of relevant charts from a short prompt. See Build a Dashboard with AI.

Text & image widget
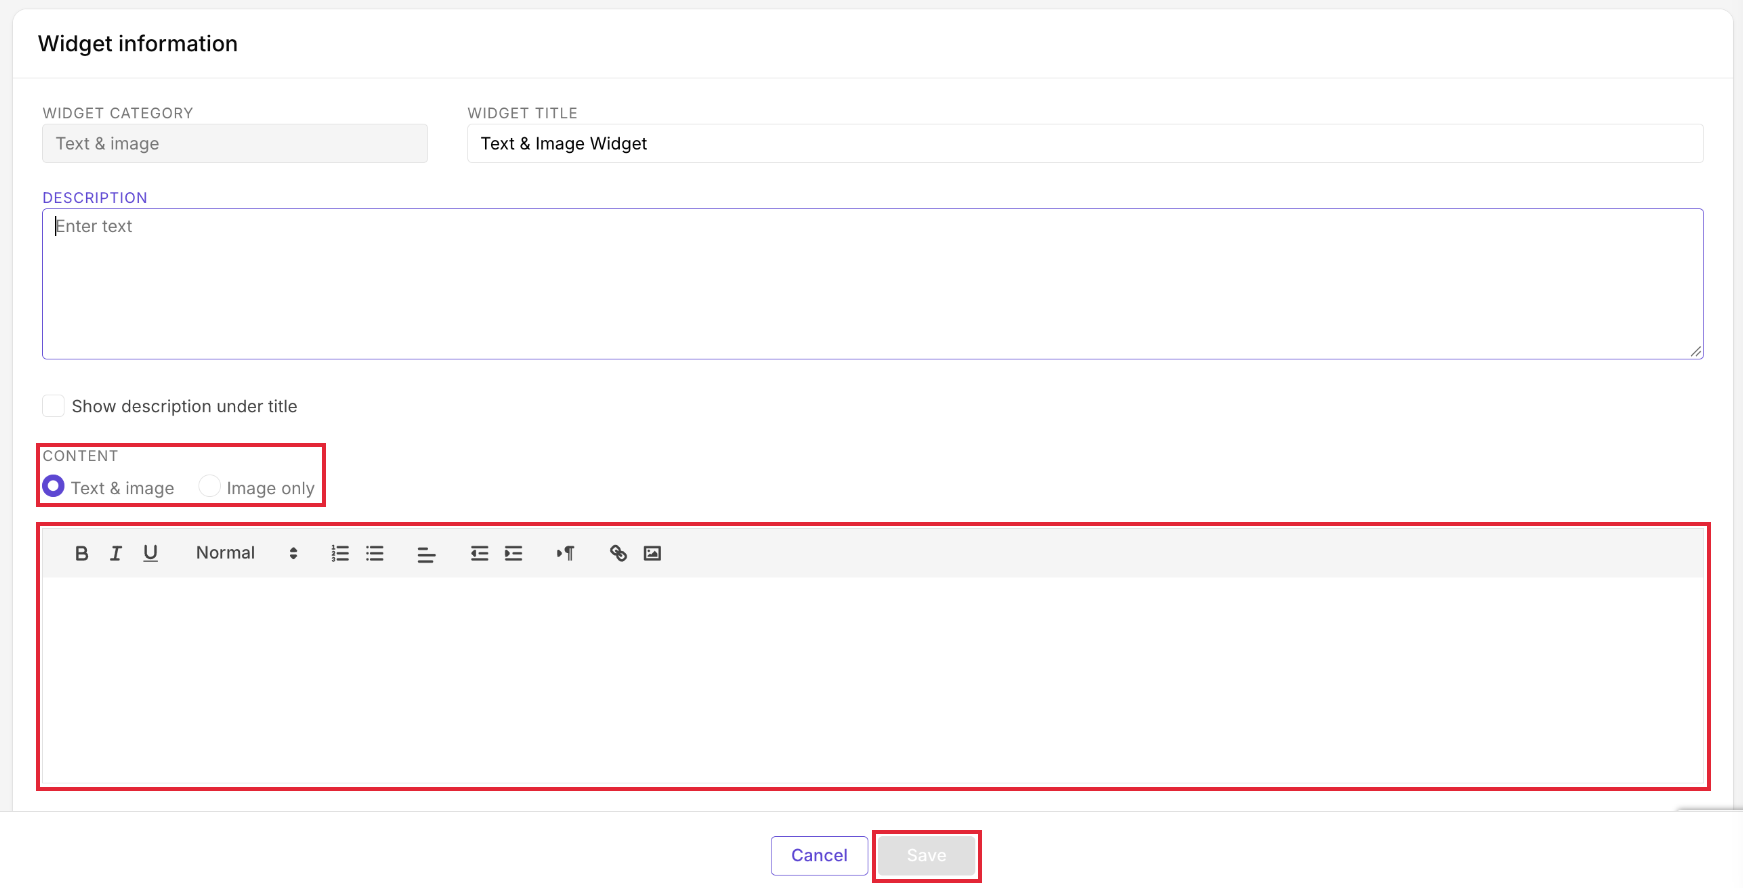
‘Text & image’ widgets allow you to enter text, links and images. There are various formatting options available, so you can customise the layout of the information.
Project indicators
‘Project indicator’ widgets allow you to visualise your workspace results in a choice of chart types.
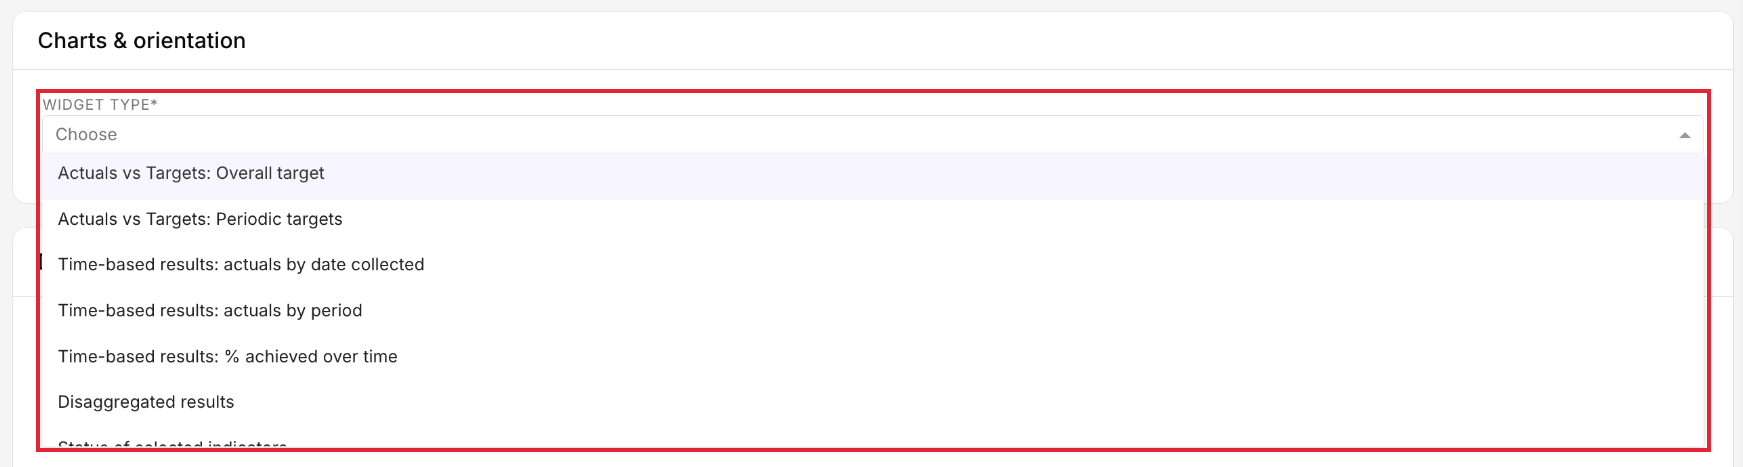
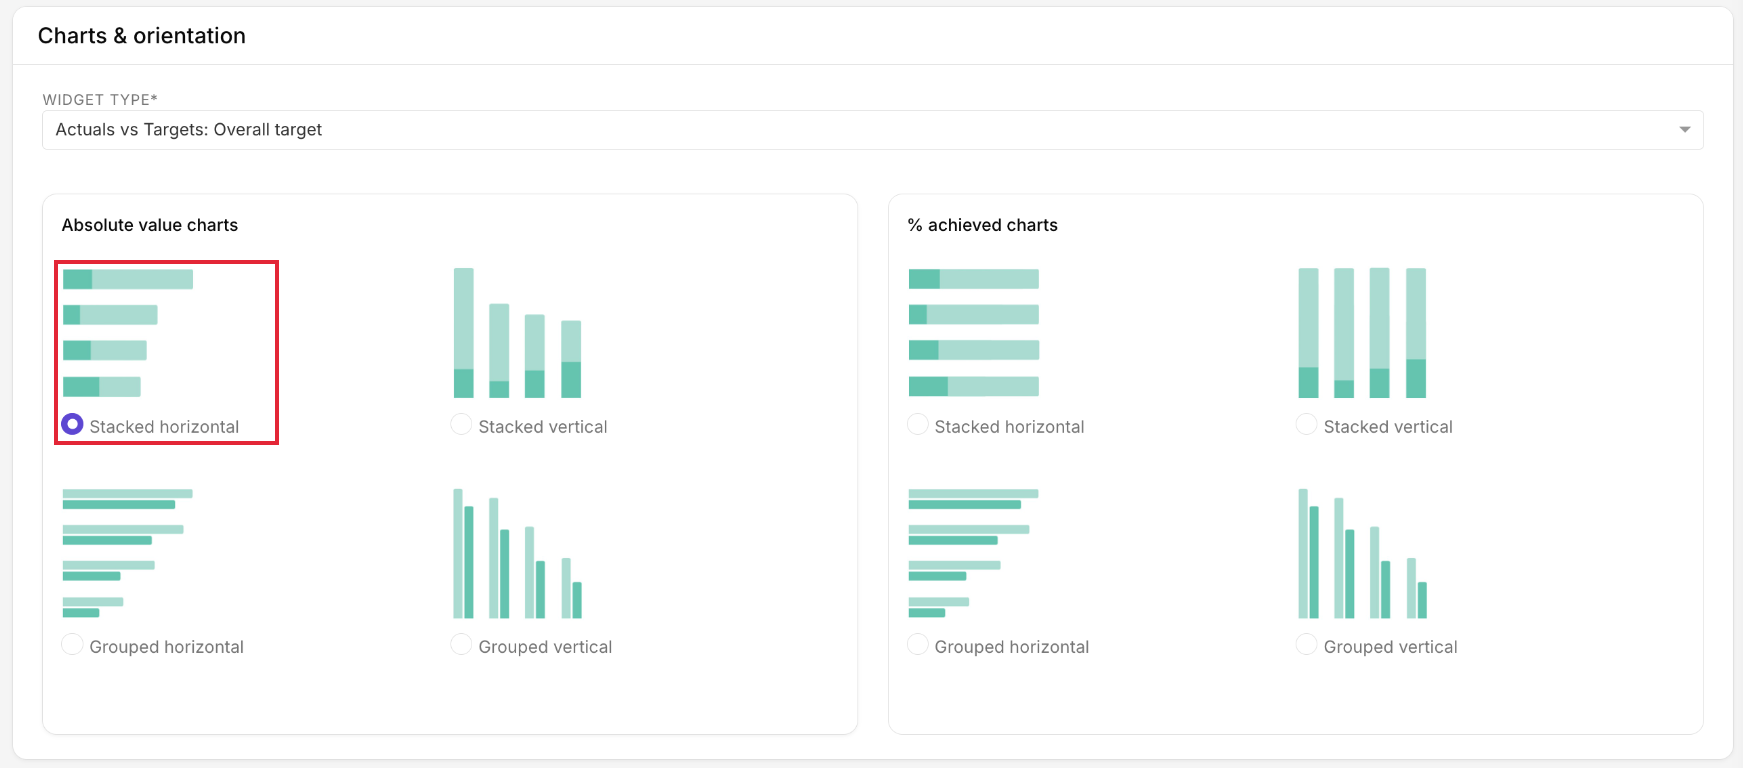
Select the chart type by first choosing the widget type under ‘Charts & orientation’. This will present the available charts relevant to displaying your data which you can then select.
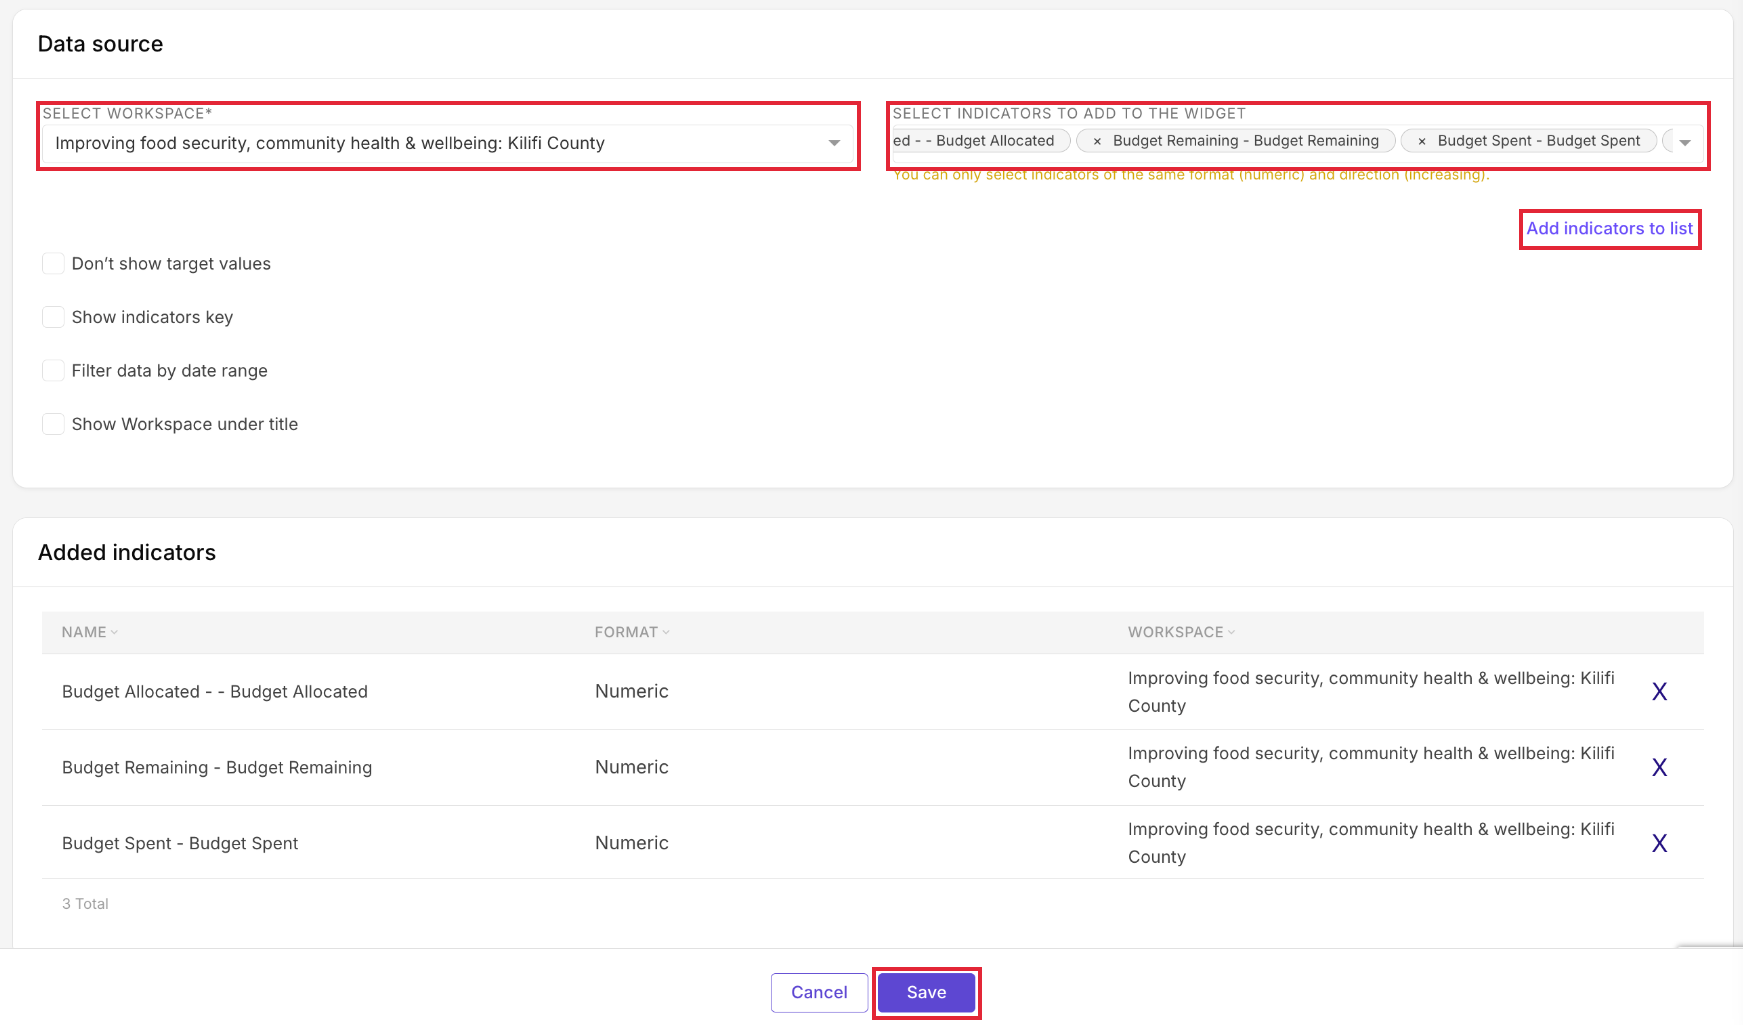
You can then select the workspace and relevant indicators you want to include in the chart by ‘Adding indicators to list’. You can repeat this, selecting different workspaces and their indicators. Depending on which chart you select there may be a number of other options available such as selecting a date range for your results and hiding target values in the chart.
Budget data
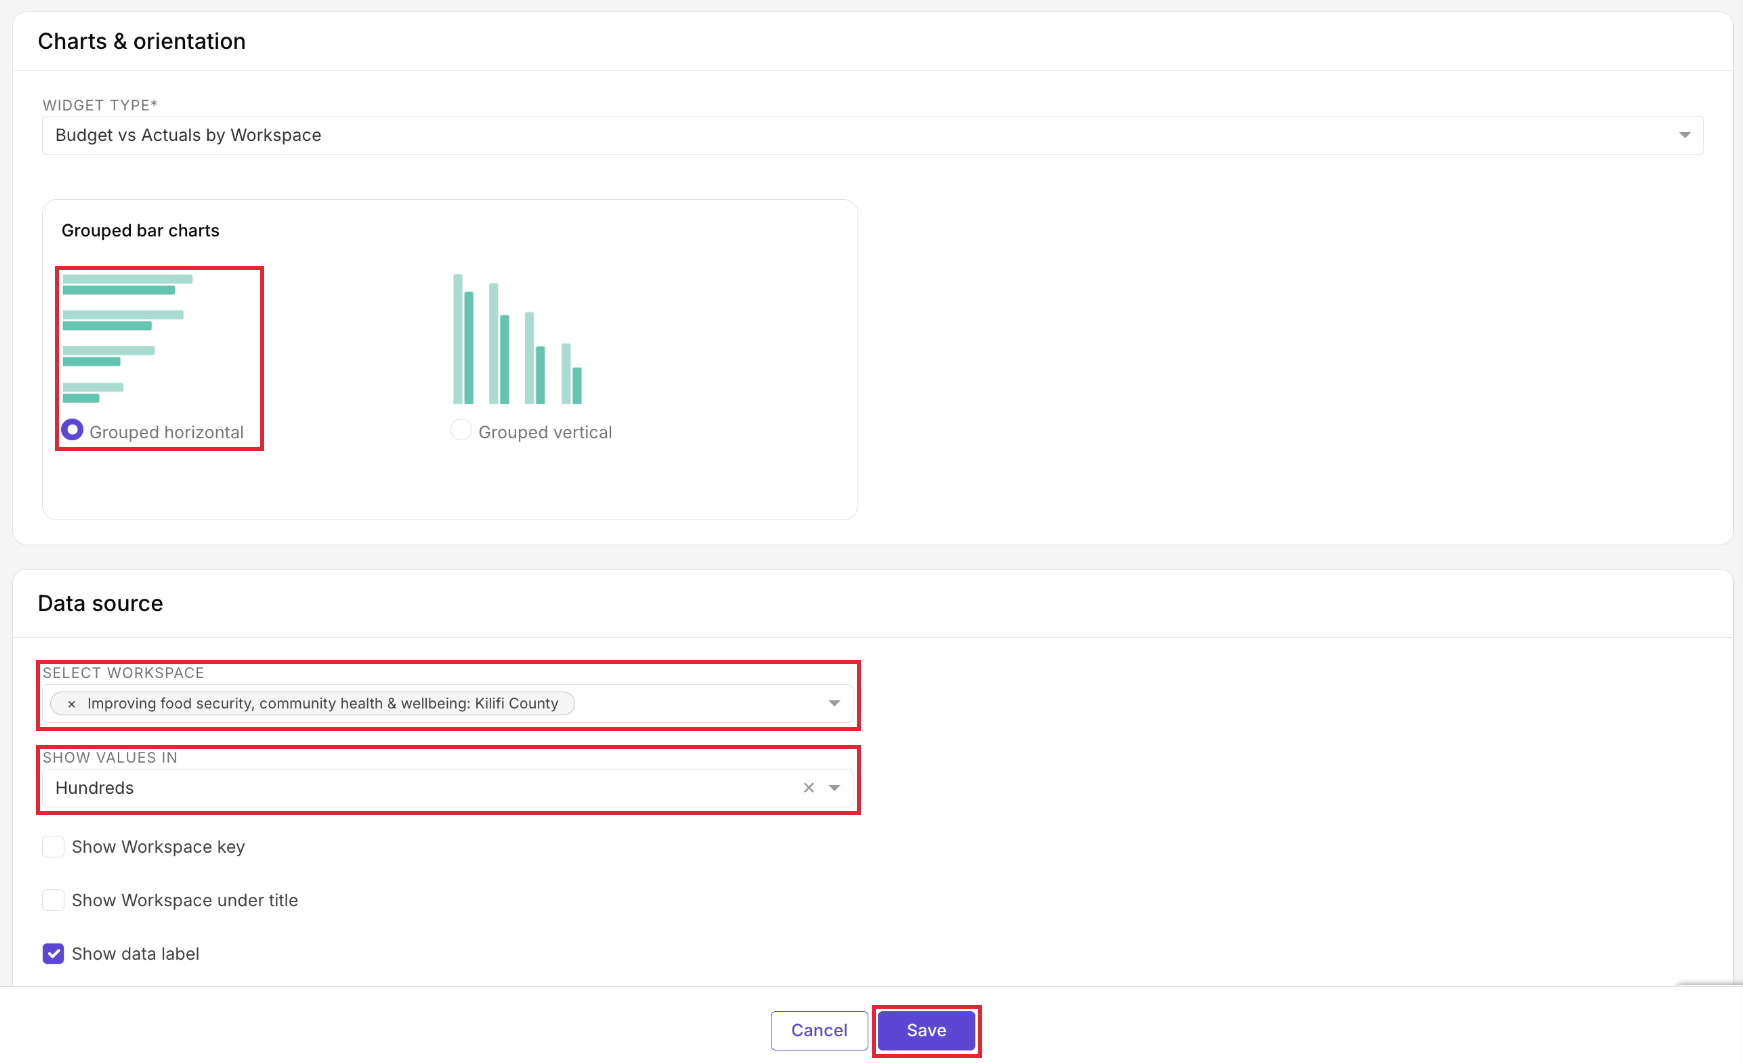
‘Budget data’ widgets allow data entered at the activity level to be viewed in the budget dashboards. Select the chart type under ‘Charts and Orientation’. Here you can choose the ‘Budget vs Actuals’ comparing whole workspaces or by selecting individual Activities/ Tasks/ Sub-tasks.

This will then prompt you to choose a bar chart and the relevant workspaces or activities.
Widget Details
As creator of the dashboard you can edit the overall description and style. For each widget you have the option of adding a description and having this description displayed under the title in your dashboard as well as permission to lock the widget position and size.

Organising your dashboard
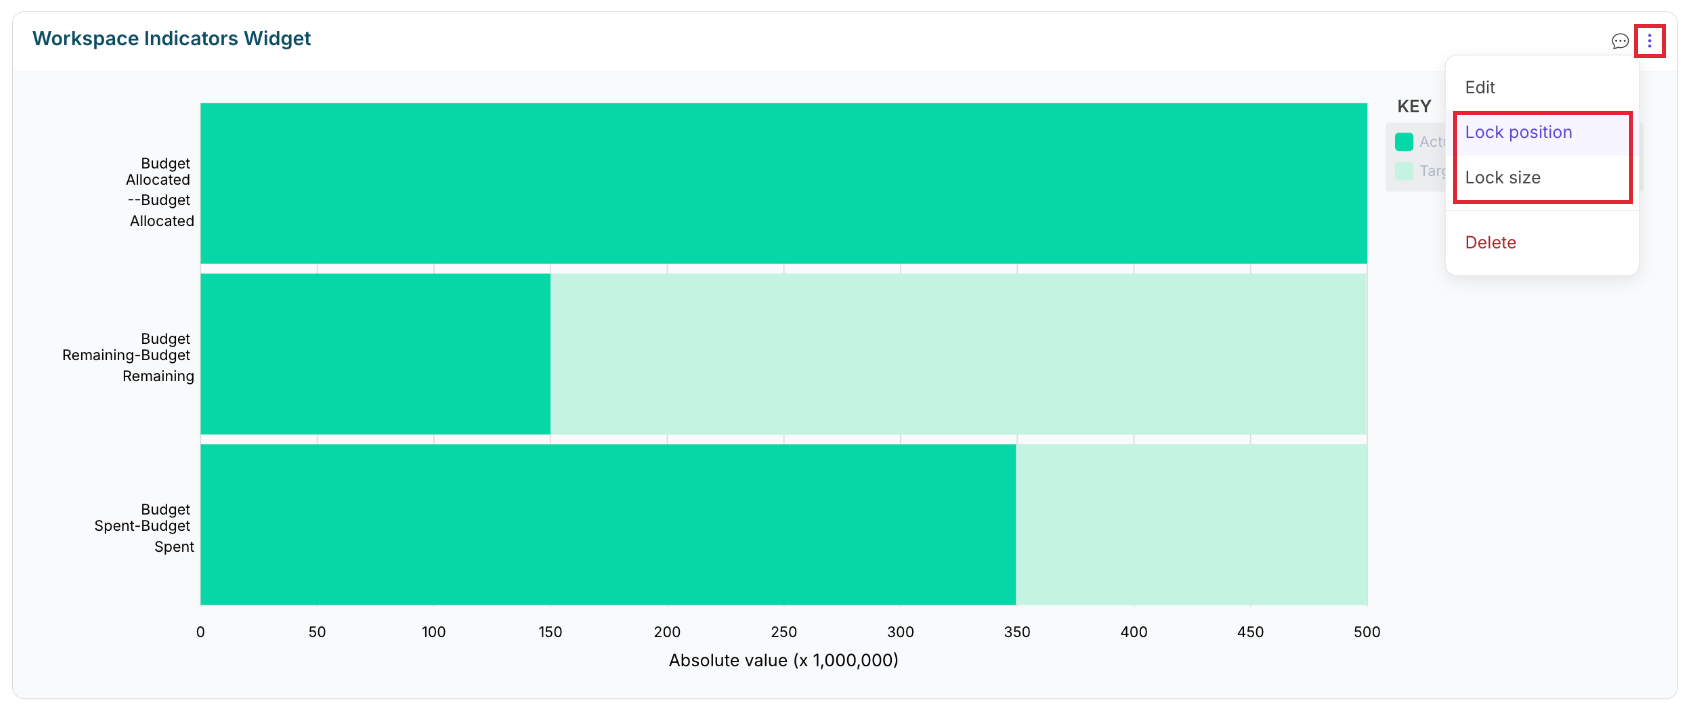
You can also drag and drop these widgets within the dashboard to customise their arrangement and resize them by dragging the bottom right corner. These can be locked in position by clicking the three dot icon like below or from within the widget as above.
GIS map
‘GIS map’ widgets show results geographically, using your organisation’s own boundary files. See GIS Map Widget.