Whether you are receiving grants, providing funds, or tracking program spending, financial management has a role to play in program implementation, monitoring, and reporting.
The ‘Activity’ section in TolaData allows you to track budget items per activity or task. You can enter a description of the budget item, the total budgeted amount, and the actual amount spent so far. Check out this video to learn more about adding budget items to your activities.
However, for more detailed financial monitoring there’s also the option to use the project indicator section for fund or grant management or monitoring of finance programs or components of your project containing financial aspects
Using TolaData for Funding and Grant Management
- Results framework: Define the specific components of your project.
- Standard indicators: Monitor spending, subsidies, grants, allocations, disbursements, etc.
- Aggregated indicators: Manage funds for specific areas or stakeholders and for the program overall by aggregating the data from your standard indicators. Aggregation is possible at as many levels as required so you can track at each level in hierarchies or chains of funding.
- Weights and adjustments: Adjust for currency conversion using the weighting feature.
- Calculation formula: Aggregated indicators can perform multiple calculations allowing you to track actuals, averages, and more with ease.
- Unit of measurement: Insert your unit of measurement to make the currency clear.
- Dashboards: Report internally and externally using dashboards. Display the total spent versus the allocated and disbursed amounts to date in a bar graph, break down disaggregated expenses in a pie chart, use a cumulative chart to monitor your spending over time, or use percentage achieved charts to display and compare burn rates.
- Disaggregation types: Break down your spending using custom disaggregations.
Use Case A: Grant/Local Subsidy Management
Organisation A is using TolaData for the monitoring and evaluation of a program where they are in charge of disbursing grants to three local institutions. The three local institutions are all directing funds to three areas within their institution – training materials, equipment, and first aid kits. Organisation A needs to keep track of how much money is being received by each institution, as well as to which area the funds are being directed within the local institutions individually and overall.
Organisation A has set up a project in TolaData to track this information. They have created a results framework showing the three institutions under the overall results
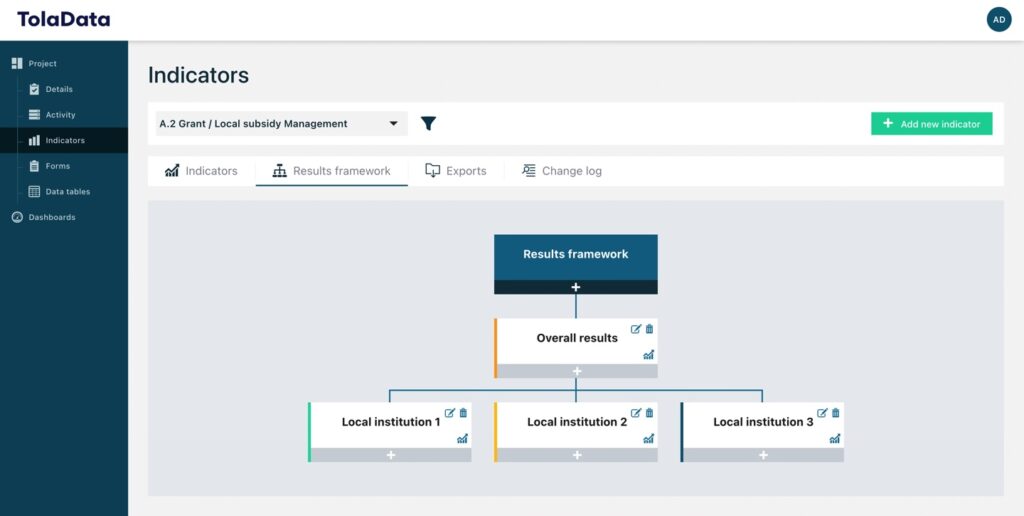
Tracking spend per local institution
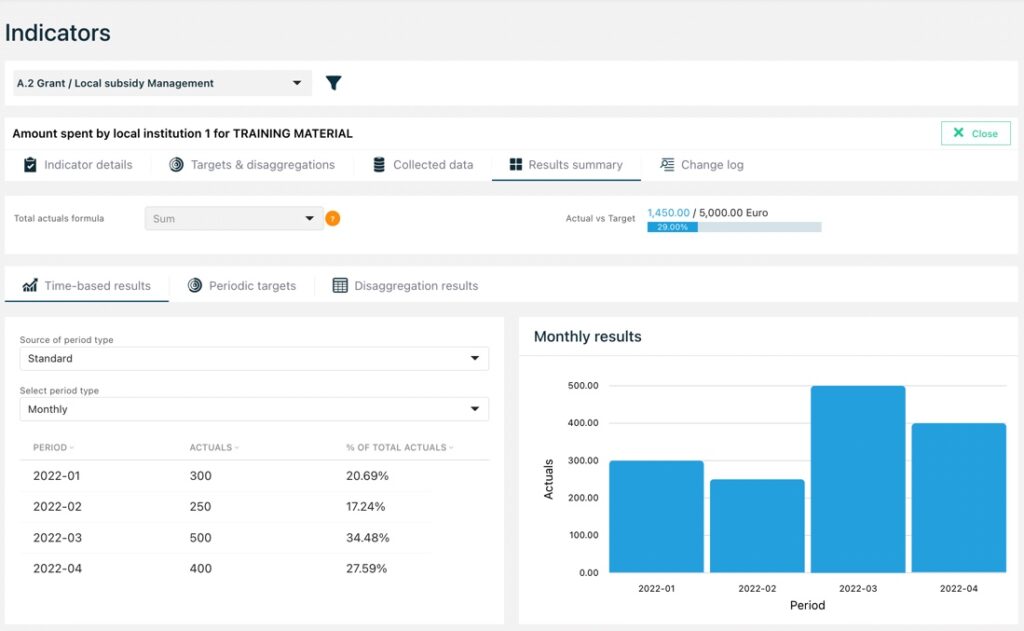
For each institution, they have created three standard indicators, one for each area of spending, so they can track the amount spent to date. Every month each institution reports the amount spent that month in each funding area.
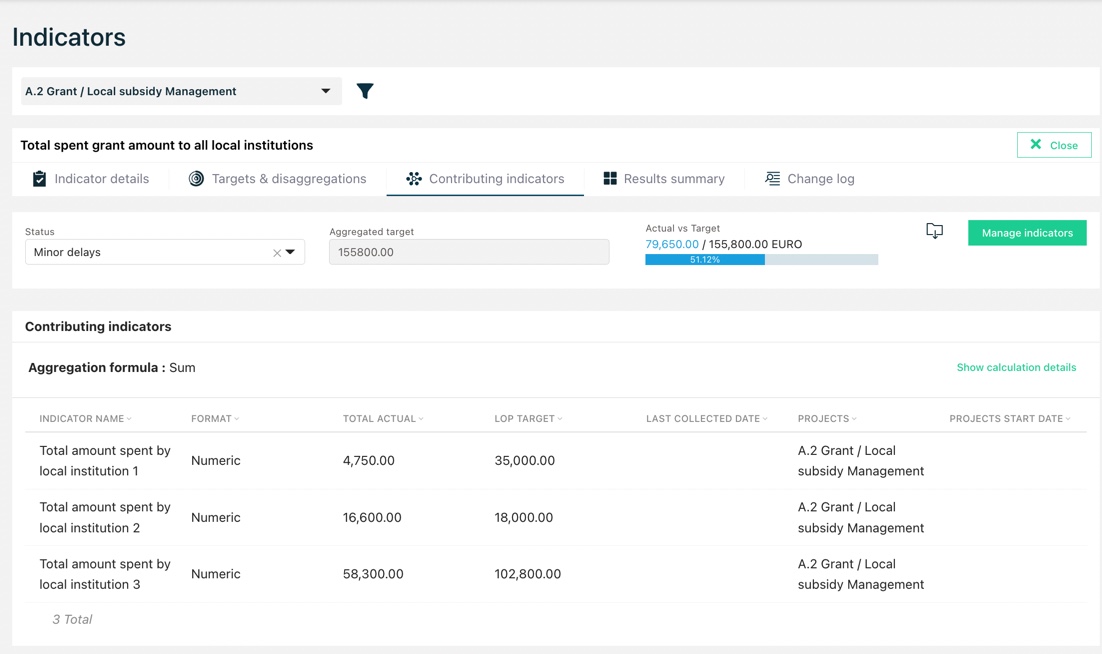
They have also created an aggregated indicator for each institution that links the three standard indicators for that institution as contributing indicators so they can see the total amount spent to date per institution. This aggregated indicator updates automatically when new spend is reported by the institutions per funding area.
Tracking the overall spend
Under Overall Results, they have created aggregated indicators for each spending area, as well as for the total amount spent. They have linked the relevant indicators for each institution as contributing indicators so they can track the total amount spent per area as well as in total for the whole funding program. These aggregated indicators update automatically when new spend is reported by the institutions per funding area.
They have created a dashboard to visualise the budget tracking side by side. This dashboard updates in real-time and is used to report to partners and other stakeholders.
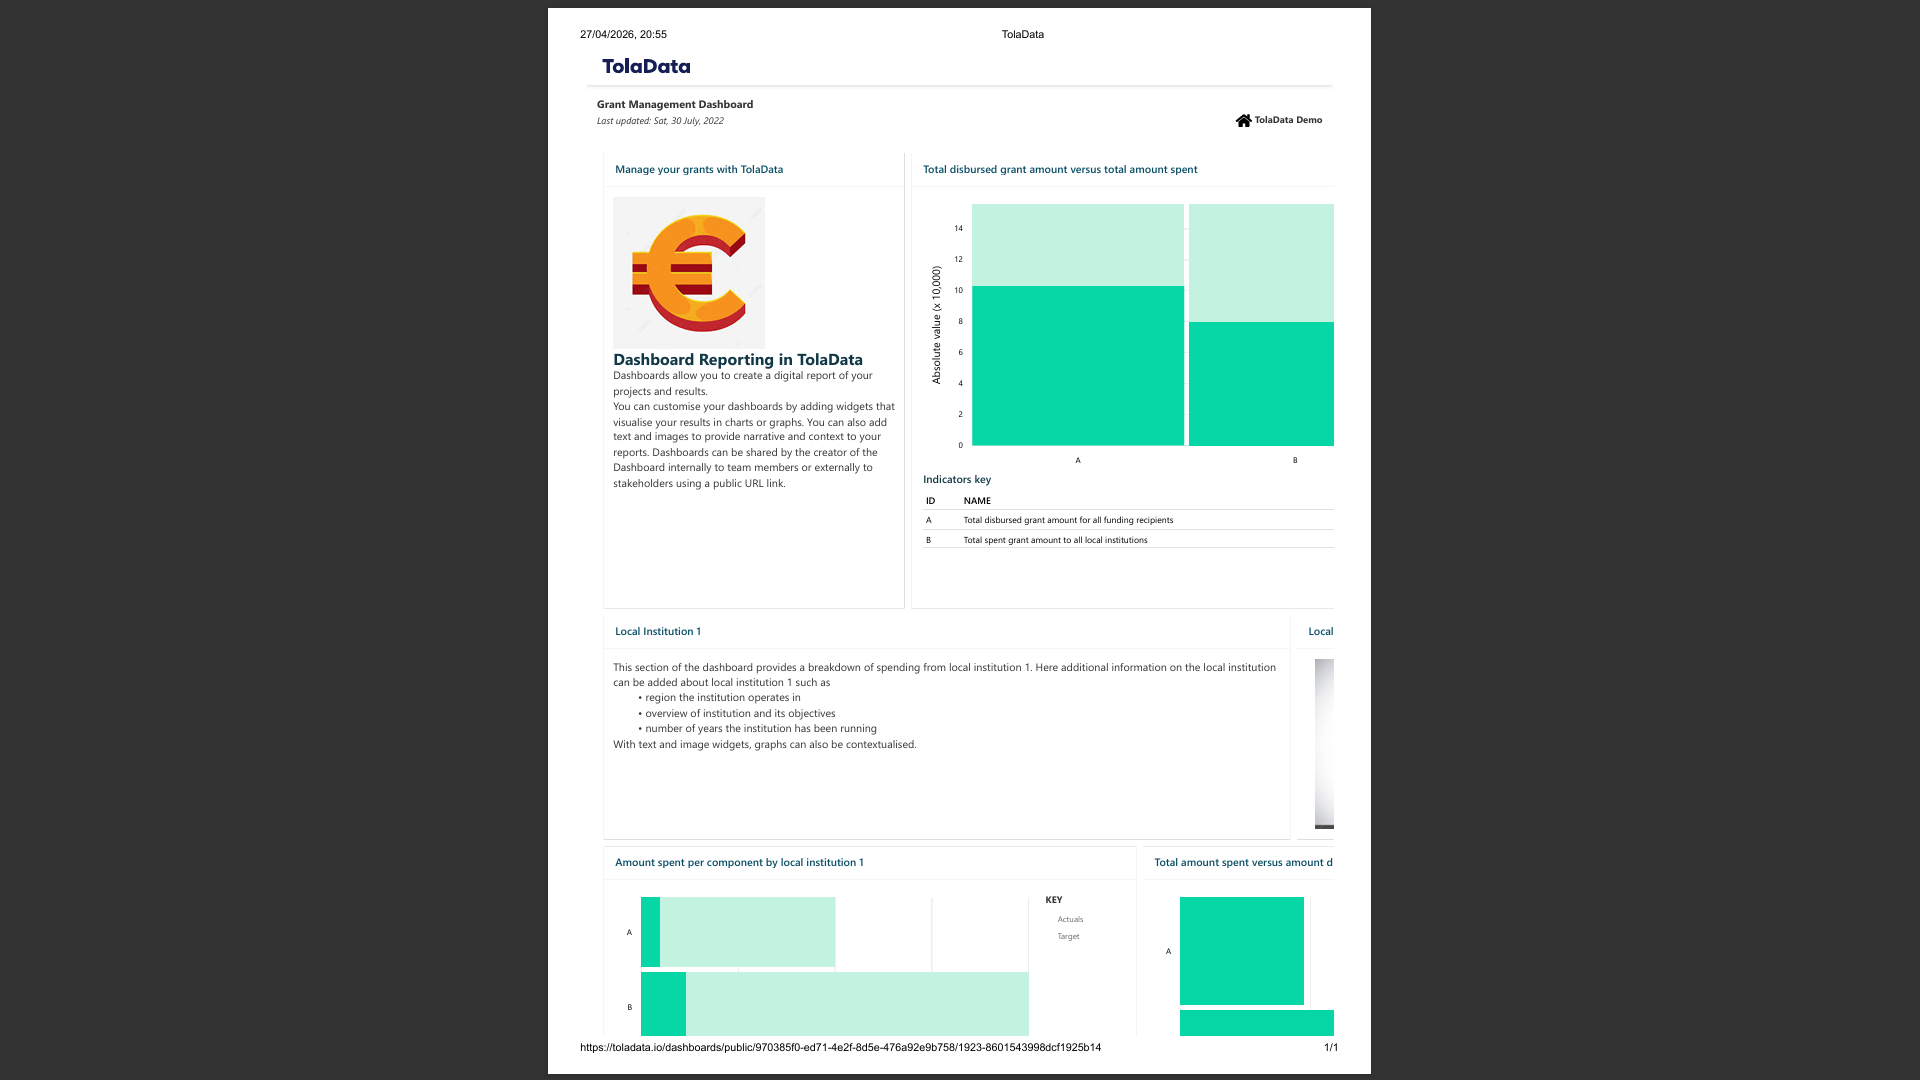
The Dashboard can be viewed by users outside the organisation via a URL. You can find an example dashboard here.
Use Case B: Donor/Fund Management
Organisation B is implementing a program that has two components. The program is funded by three donors who committed to provide specific amounts to the overall program, with specific amounts allocated to each component.
The donors disburse amounts to Organisation B who then uses the received donor funds to deliver the program and all its components.
Organisation B is in charge of coordinating and managing the funds they receive and uses TolaData for both, the monitoring of the program activities, and to keep track of the financial disbursements from the donors as well as how much they have spent so far for each component and in total.
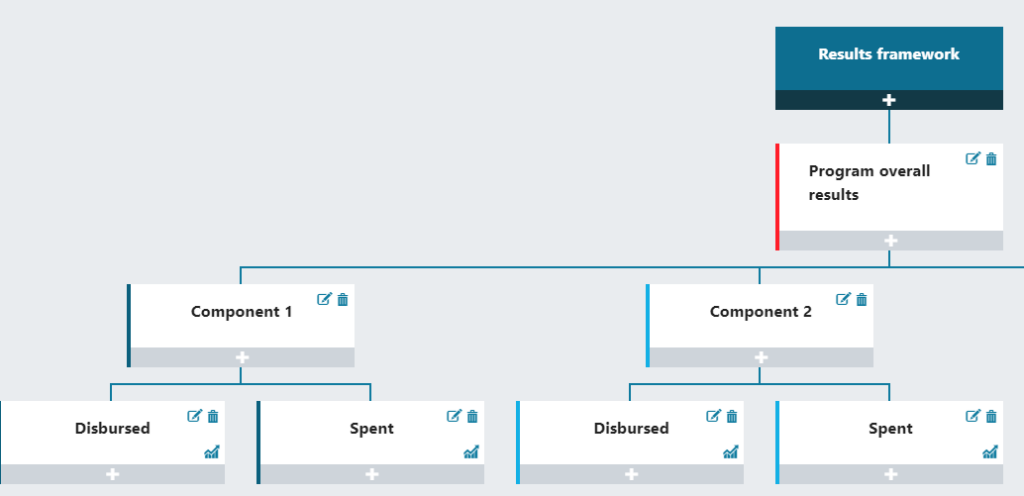
Organisation B has set up a project in TolaData to track this financial information. They have created a results framework showing the components, and for each the disbursed and spent amounts.
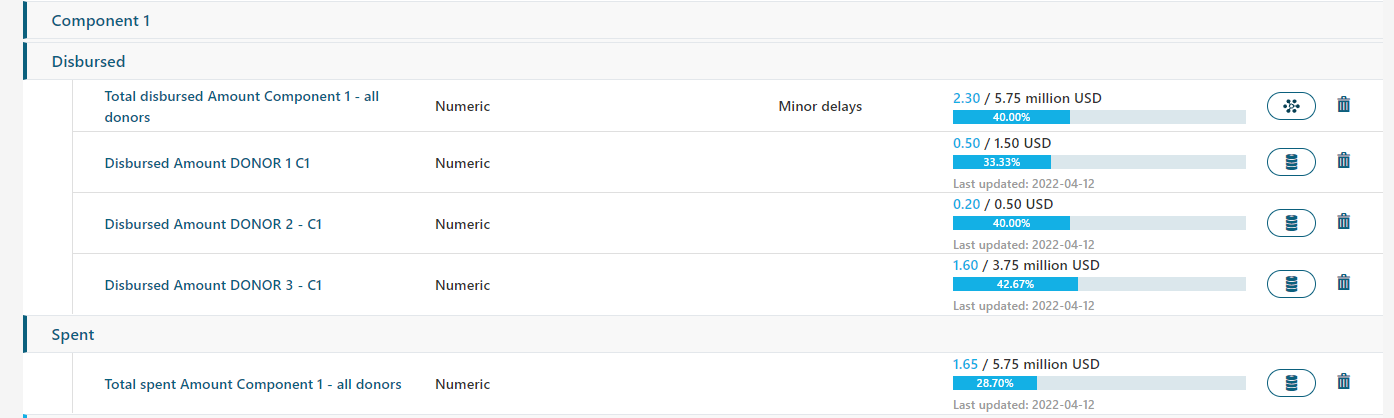
Tracking disbursed amounts per donor at the component level
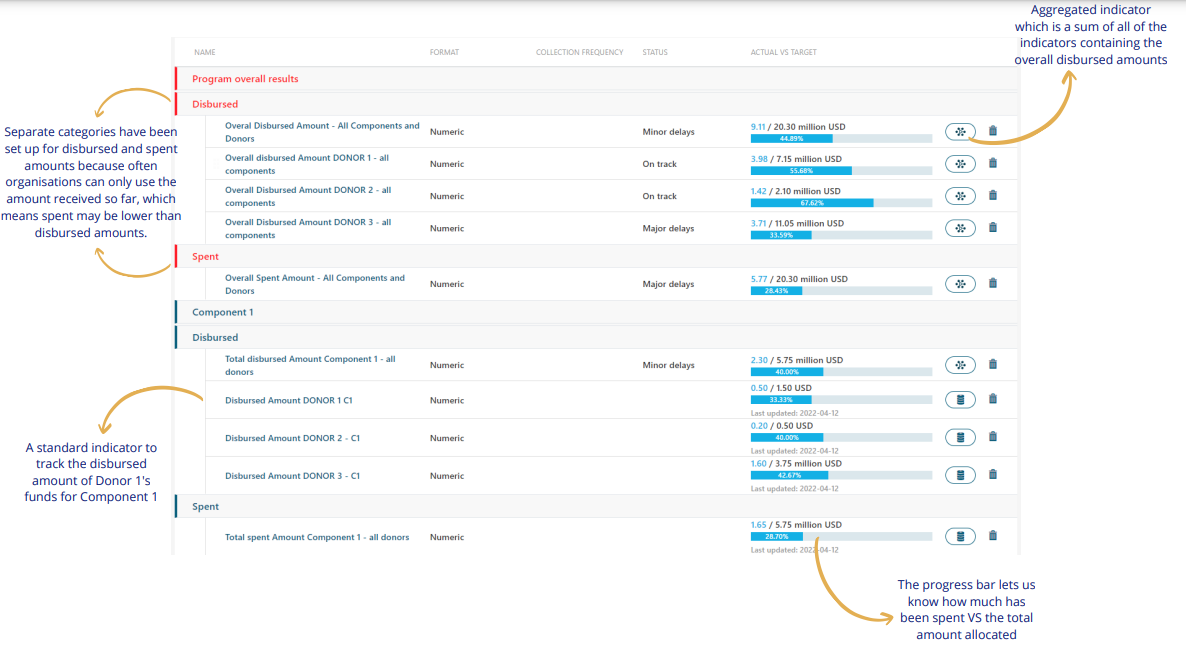
As the donors are committed to providing specific amounts for each component, Organisation B wants to track how much money was disbursed per donor for each of the 2 components. They do this using an indicator for each donor within each component. The committed amount as per the donor contracts is set as the target and each time a disbursement is received it is recorded against the relevant indicator. In doing so, the total amount received to date can be tracked per donor and in total by aggregating the results of the three indicators.
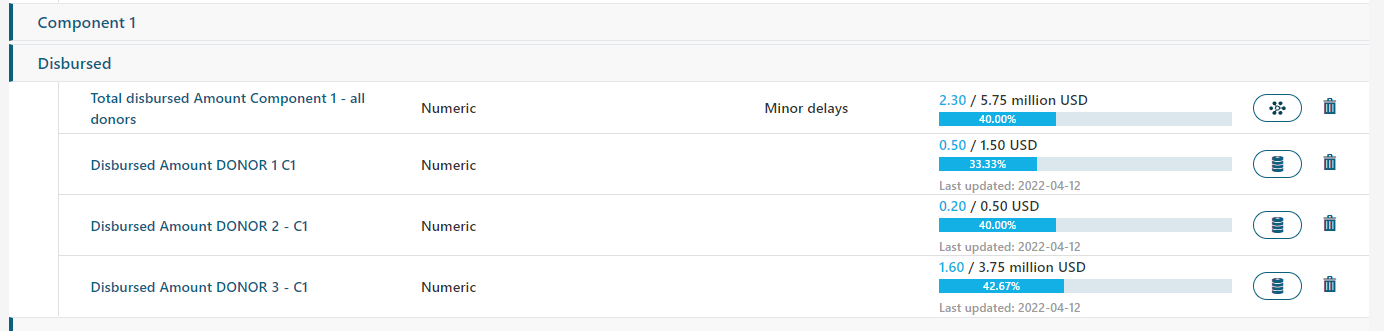
In this example, you can see that donor 1 has committed to providing 1.5 million USD to component 1 and so far has transferred (disbursed) 0.5 million USD.
The aggregated indicator for the total disbursed amounts directed for component 1 shows the total amounts disbursed to date from all donors (2.3 million USD) versus the total committed amount (5.75 million USD) for component 1. This aggregated indicator updates automatically when new disbursements are reported for each donor.
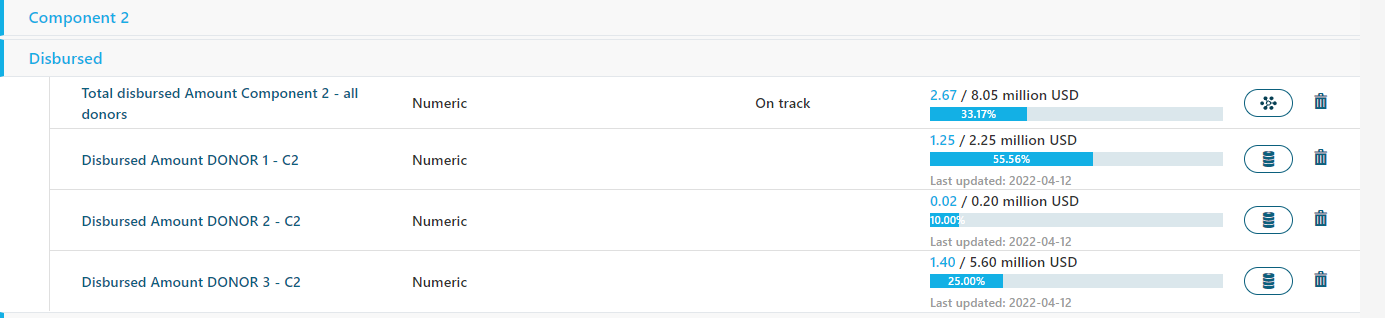
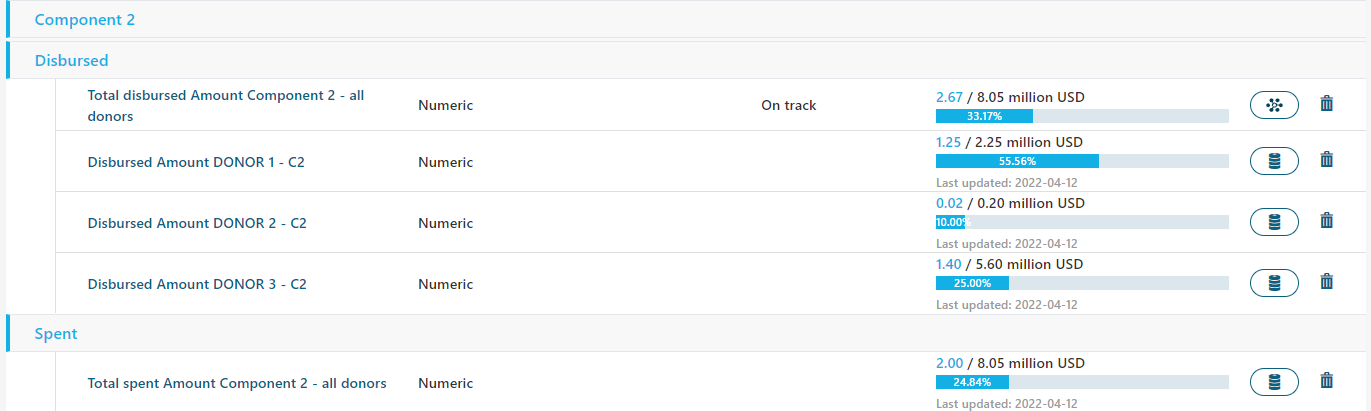
This same structure and logic is used for component 2:
Tracking spent amounts at the component level
Organisation B also has to track how much has been spent for each component versus the committed budget.
For component 1, the overall committed funds are 5.75 million USD.
Organisation B tracks how much is spent to date so they can easily see how much is still available. This is done using an indicator with a target of 5.75 million USD. Each month they report the amount spent for that period so they can track the total spent to date versus the budget.
This same logic applies to component 2.
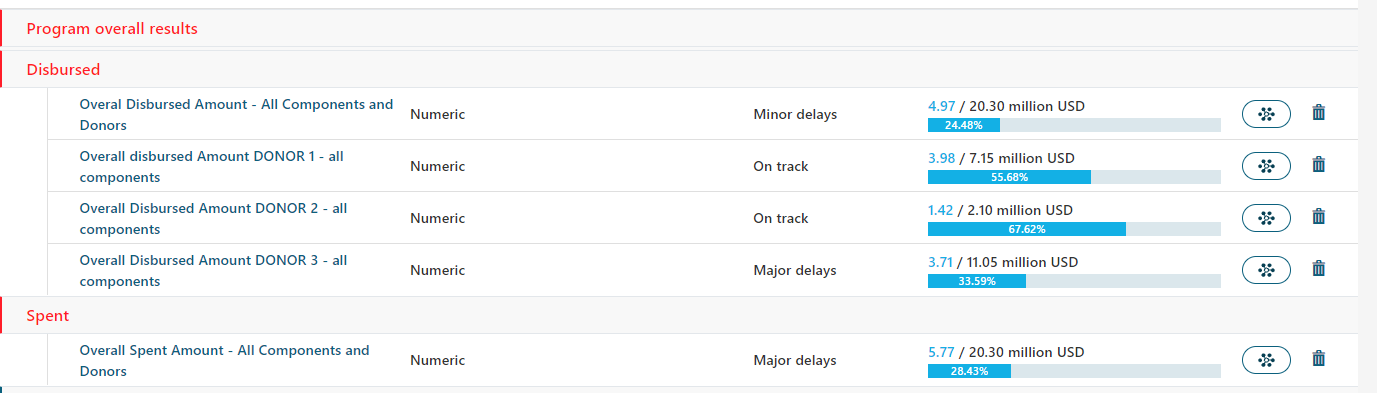
Tracking the overall disbursed and spent amounts
It is also important that Organisation B tracks their spending against their disbursements to date to monitor their cash flow and to flag when they need to request further disbursements from the donors. This is done using aggregated indicators that calculate the total amount disbursed per donor to date, as well as the overall program funding received to date. Another aggregated indicator tracks the total spend to date across all components. These aggregated indicators update automatically when new amounts are reported to any of the indicators at the component level.
Monitoring cash flow and liquidity
Organisation B also needs to keep track of how much they are spending versus the number of funds they have actually received to date. In doing so, they can easily see if they are running out of available funds and when they need to request further disbursements from the donors. They track this by using an aggregated indicator with a subtraction formula which gives them an automatic calculation of the difference between the total funding received to date (i.e. the disbursements from all donors) and the total spent amount across the whole program.
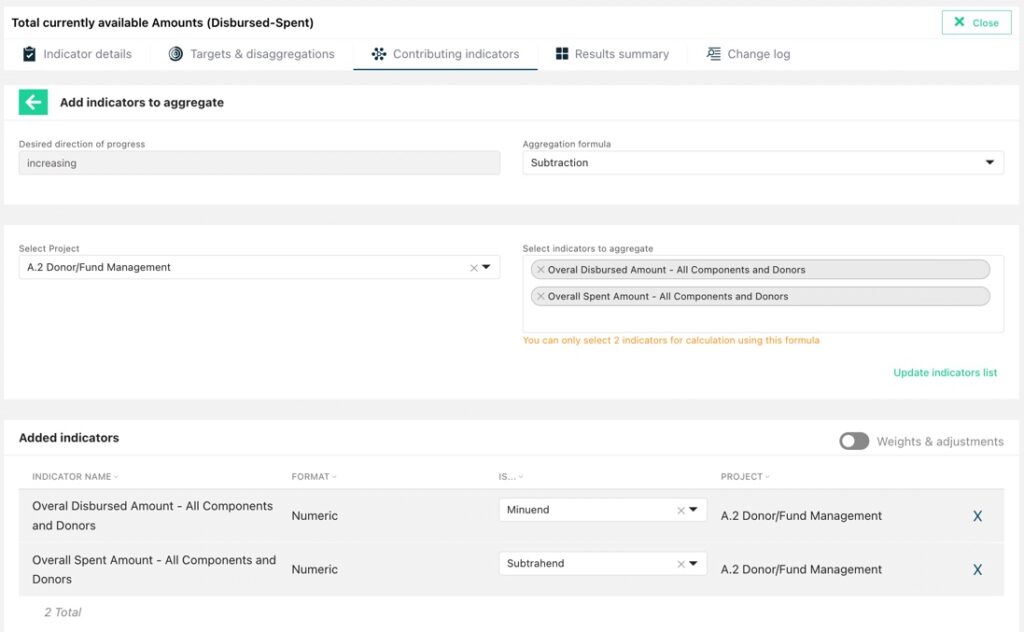
Here we can see the total amount spent to date (5.77 million USD) is subtracted from the total disbursements to date (5.97 million USD) indicating that they have 0.2 million USD available to spend before they require additional disbursements from the donors.
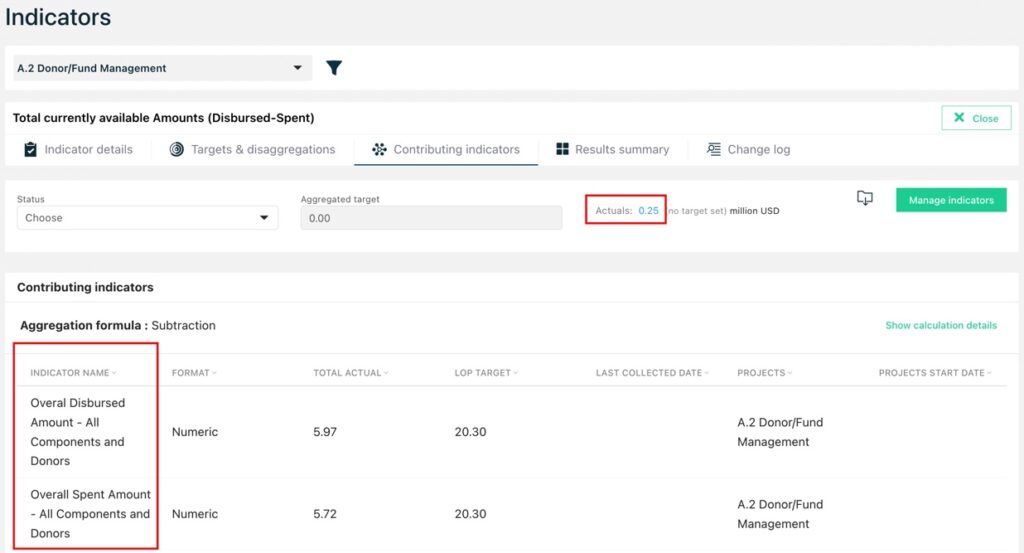
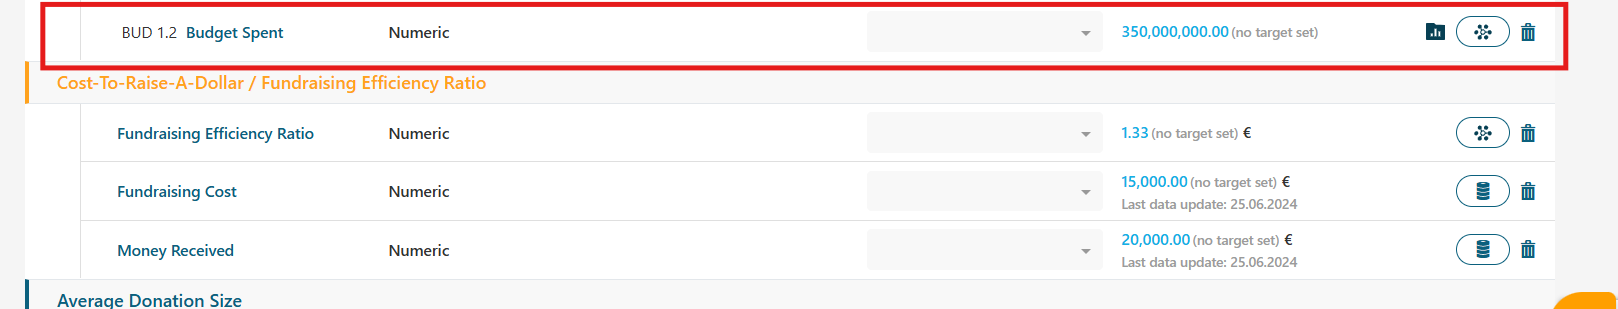
Below is an overview of the indicators used to track funding
The organisation has created a dashboard to visualise the donor funding. This dashboard updates in real-time and is used to report to partners and other stakeholders.
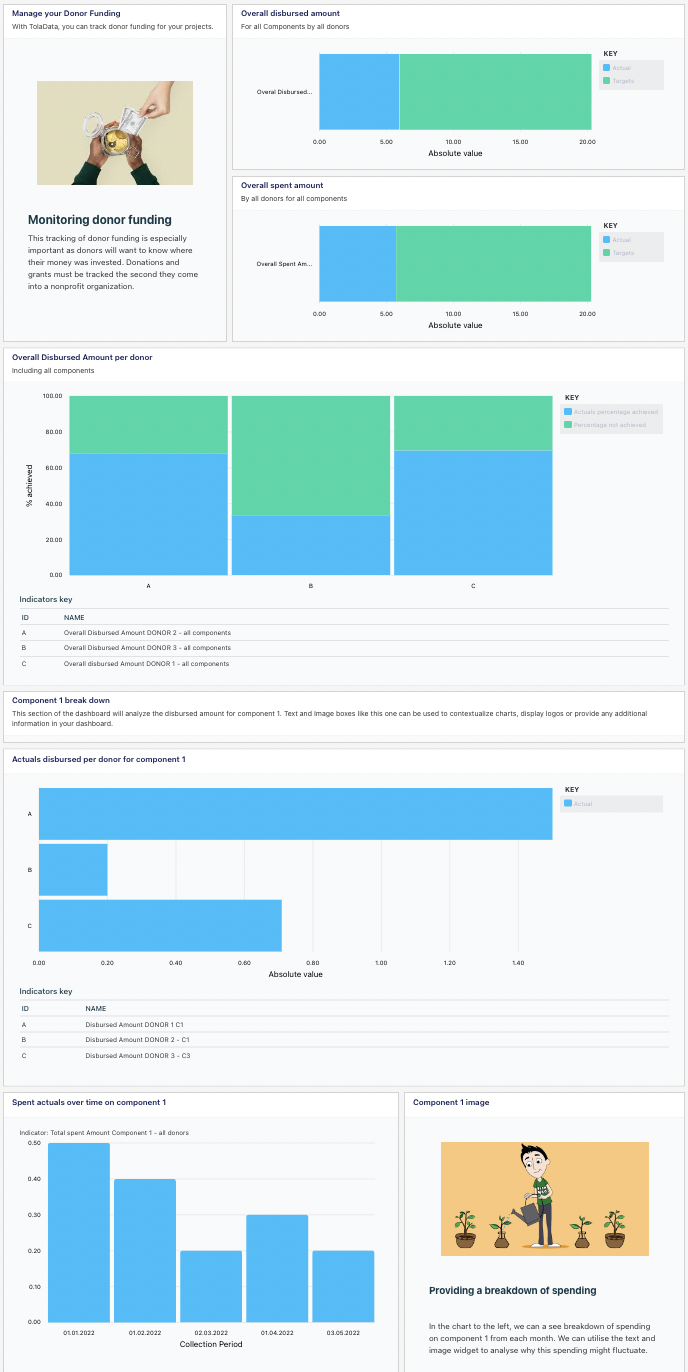
The Dashboard can be viewed by users outside the organisation via a URL. You can find an example dashboard here.
Want to learn more? Whether you have similar needs to those of Organisation A, Organisation B, or you have a totally different case where you want to track financial data, our Digital Solutions Consultants are ready to help you set up your data in TolaData. Contact info@toladata.com for more information.