You can create custom disaggregations for your indicators using TolaData’s disaggregation management tools. Disaggregation types are completely defined by you, so you can track your data according to the specific disaggregation values required for your data analysis and to meet reporting requirements.
Managing disaggregation types
Disaggregation types are managed in the ‘Disaggregation types’ tab at the workspace level.
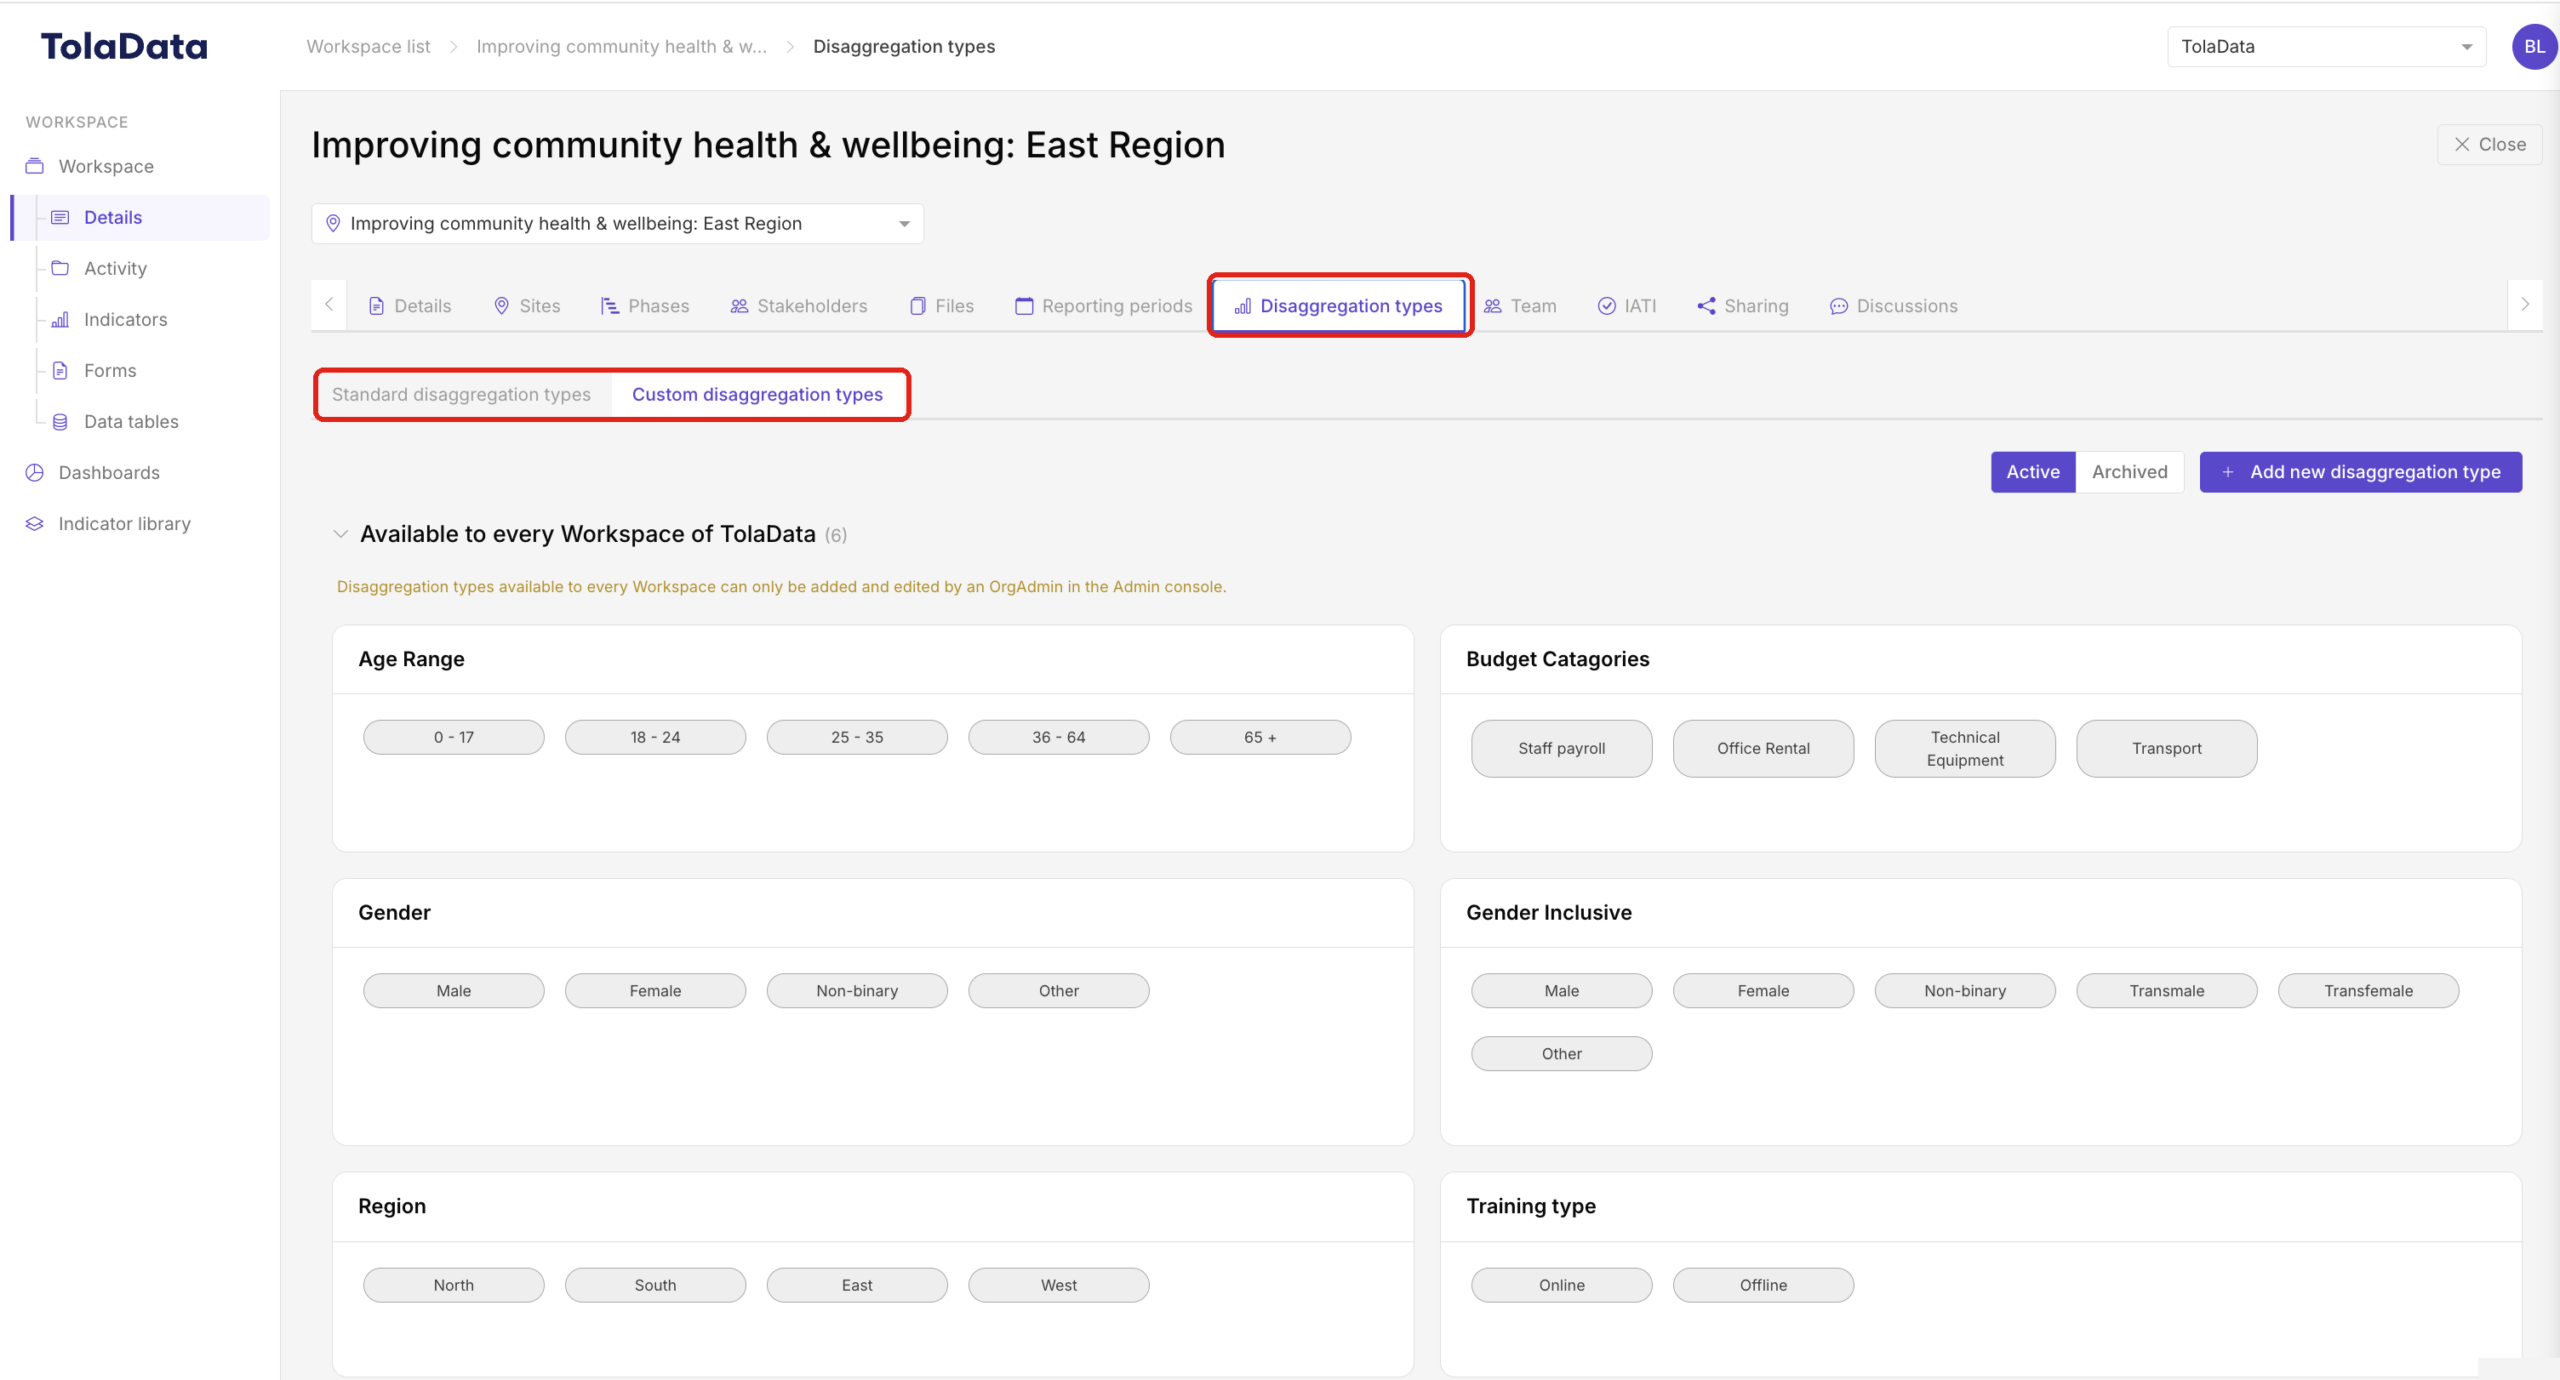
Standard disaggregation types: these are pre-set in TolaData based on commonly used disaggregation types and global standards such as ISO.
Custom disaggregation types: you can create custom disaggregation types for use across all workspaces of your organisation or specific for certain workspaces.
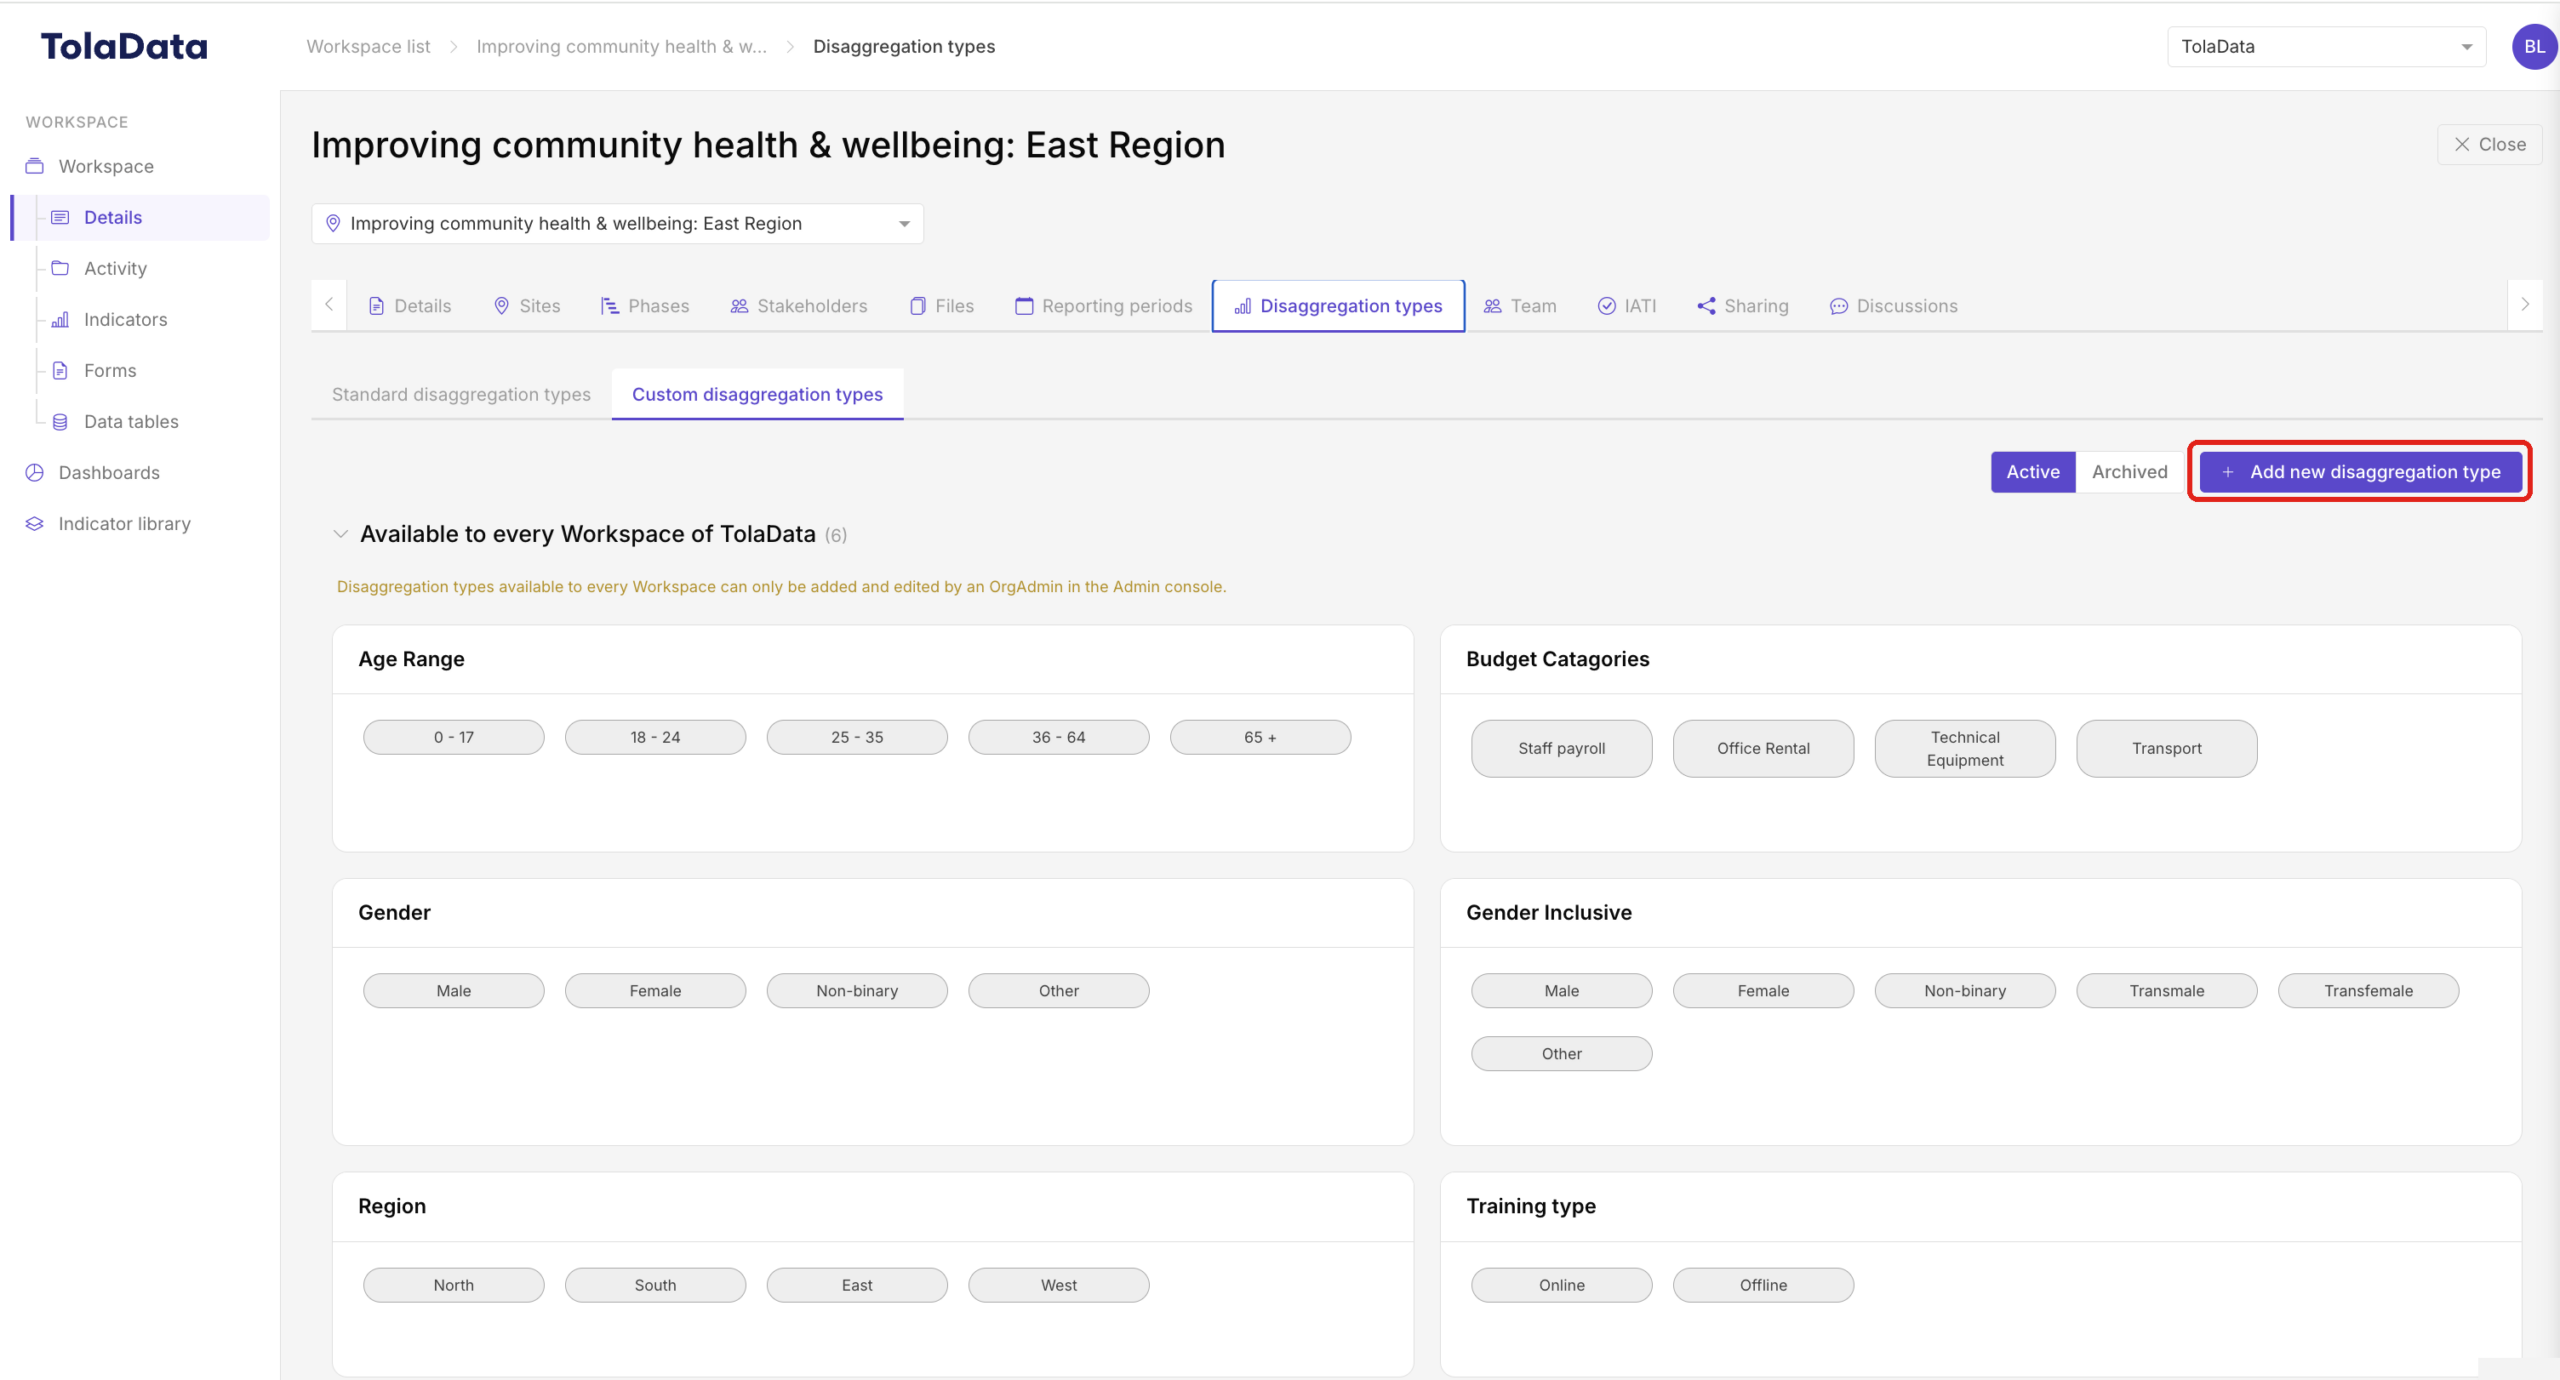
Click the green ‘Add new disaggregation’ button to create a new disaggregation type.
Enter the name for the disaggregation type (eg. “Age”) and select its availability.
Enter the disaggregation values. You must enter at least two values and can add more by clicking “Add new value”. When you are finished, click ‘Save.’
Availability
It’s important to choose the correct availability for your disaggregation type, so that it can be reused on other indicators, if that is desired. This ensures that your results can be aggregated and compared across indicators as needed and it saves your teams from having to recreate the same disaggregation types if they are used frequently in your workspaces. There are two levels of availability for a disaggregation type:
| Availability | Definition | Reason for use | Can be created/edited by |
| For this workspace only | A disaggregation type that is unique to this workspace and will not be used in any other workspace. | For a disaggregation type that will be issued on this one workspace but not on any other workspaces. Allows you to compare disaggregated results within that workspace on each indicator that uses that disaggregation type. | Org Admins. Project Admins of that workspace team. |
| For every workspace of your organisation | A disaggregation type that is used on multiple indicators across multiple workspaces. | For disaggregations that your organisation uses frequently or often reuses. Allows you to compare disaggregated results across workspaces wherever that disaggregation type is used. | Org Admins. |
How to link disaggregation types to indicators
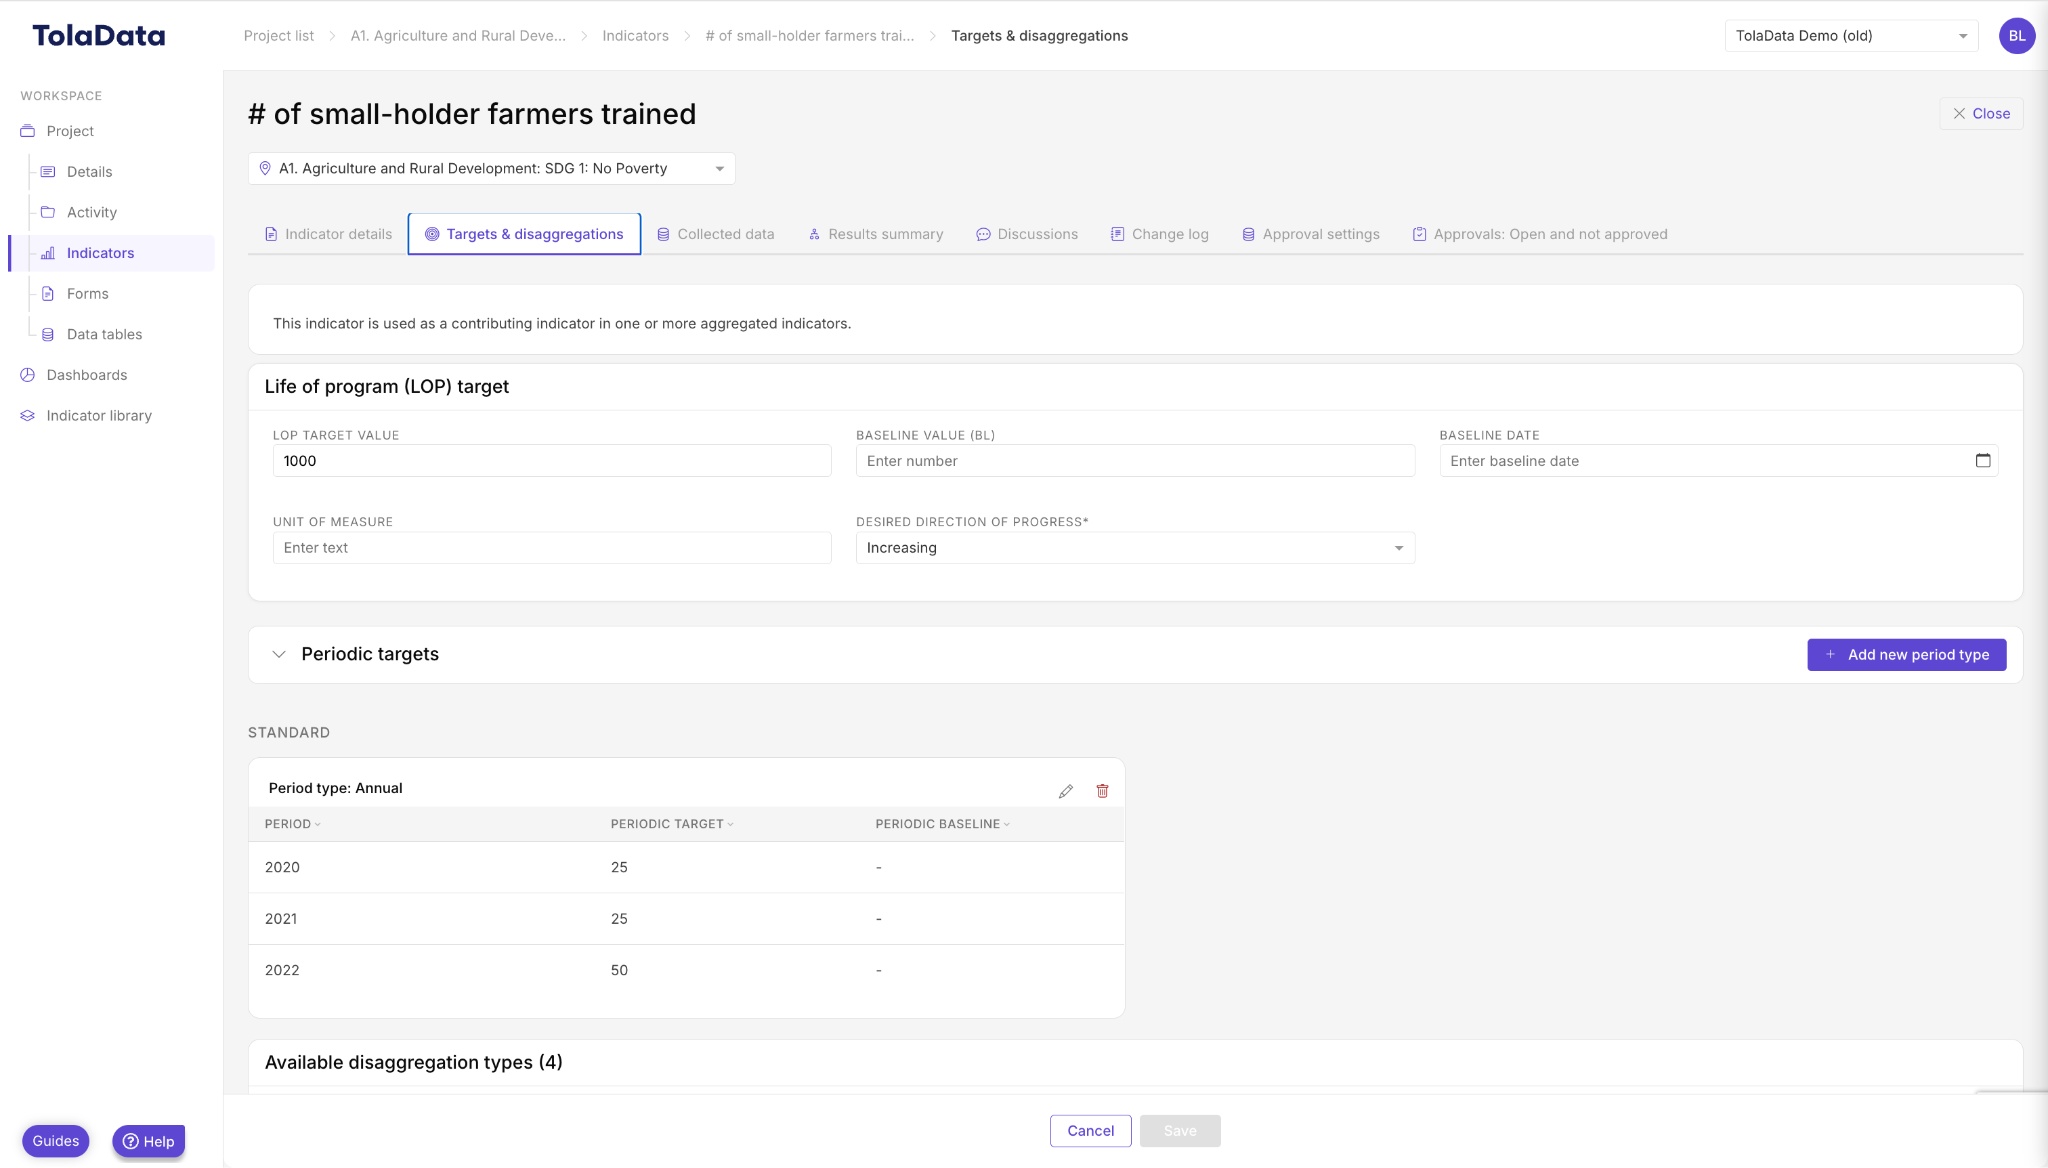
Disaggregation types can be linked to the indicators that they are relevant to at the indicator level on the “Targets and disaggregation” tab of each indicator. Once a disaggregation type is made available to an indicator, you can use it when adding collected data to disaggregate your results.
How to add disaggregated results
When you add collected data, click the ‘+ Add disaggregation button’ at the bottom of the form.
Select the disaggregation type you want to use and then add data either manually (for collected data > manual entry) or by selecting the column from your dataset that contains the disaggregated results (for collected data > pull form data tables).
You can disaggregate your results by more than one disaggregation type by clicking ‘+ Add disaggregation data’ again.
Where can I see my disaggregated results
You can see a summary of the disaggregated results for your indicator on the ‘Results summary’ tab under ‘Disaggregation results.’
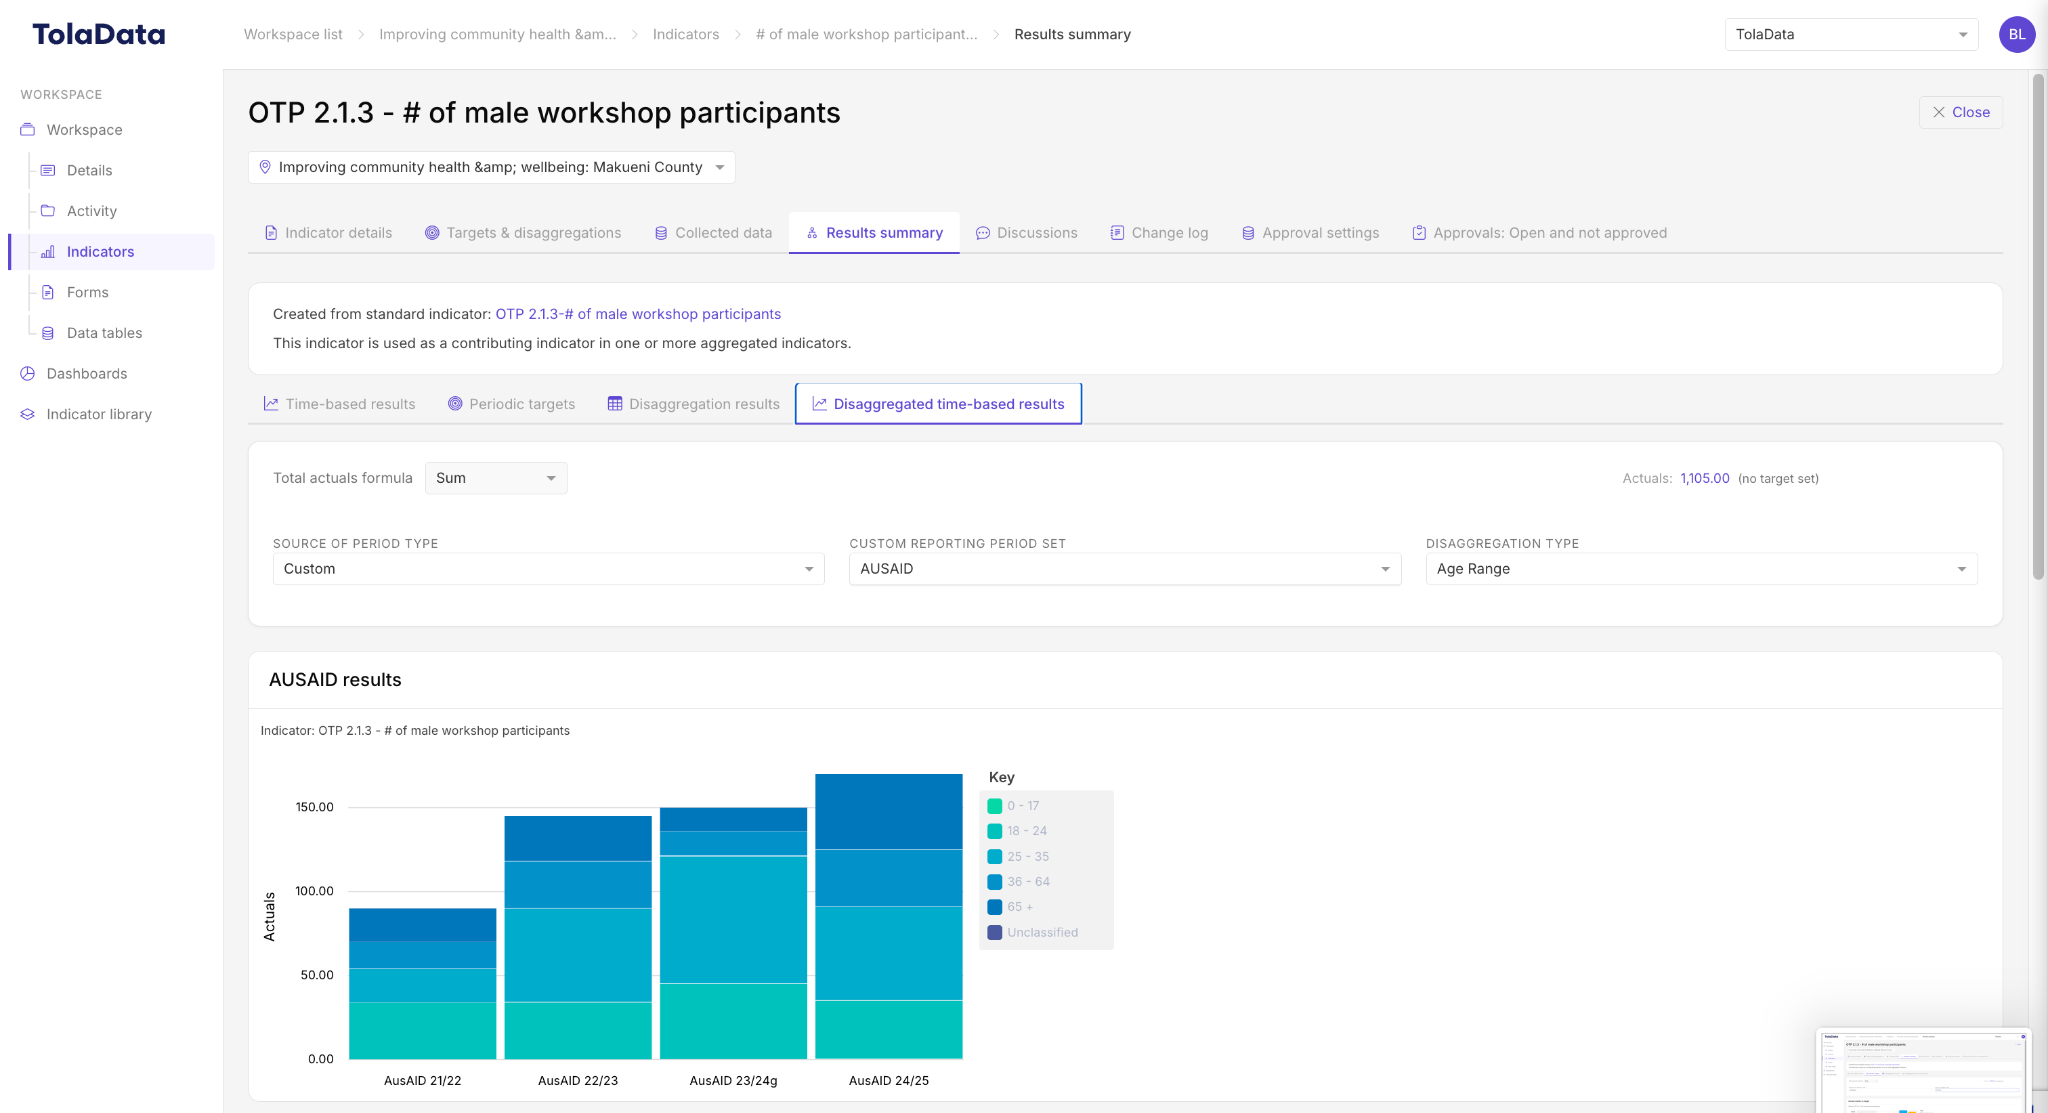
How can I visualise my disaggregation results
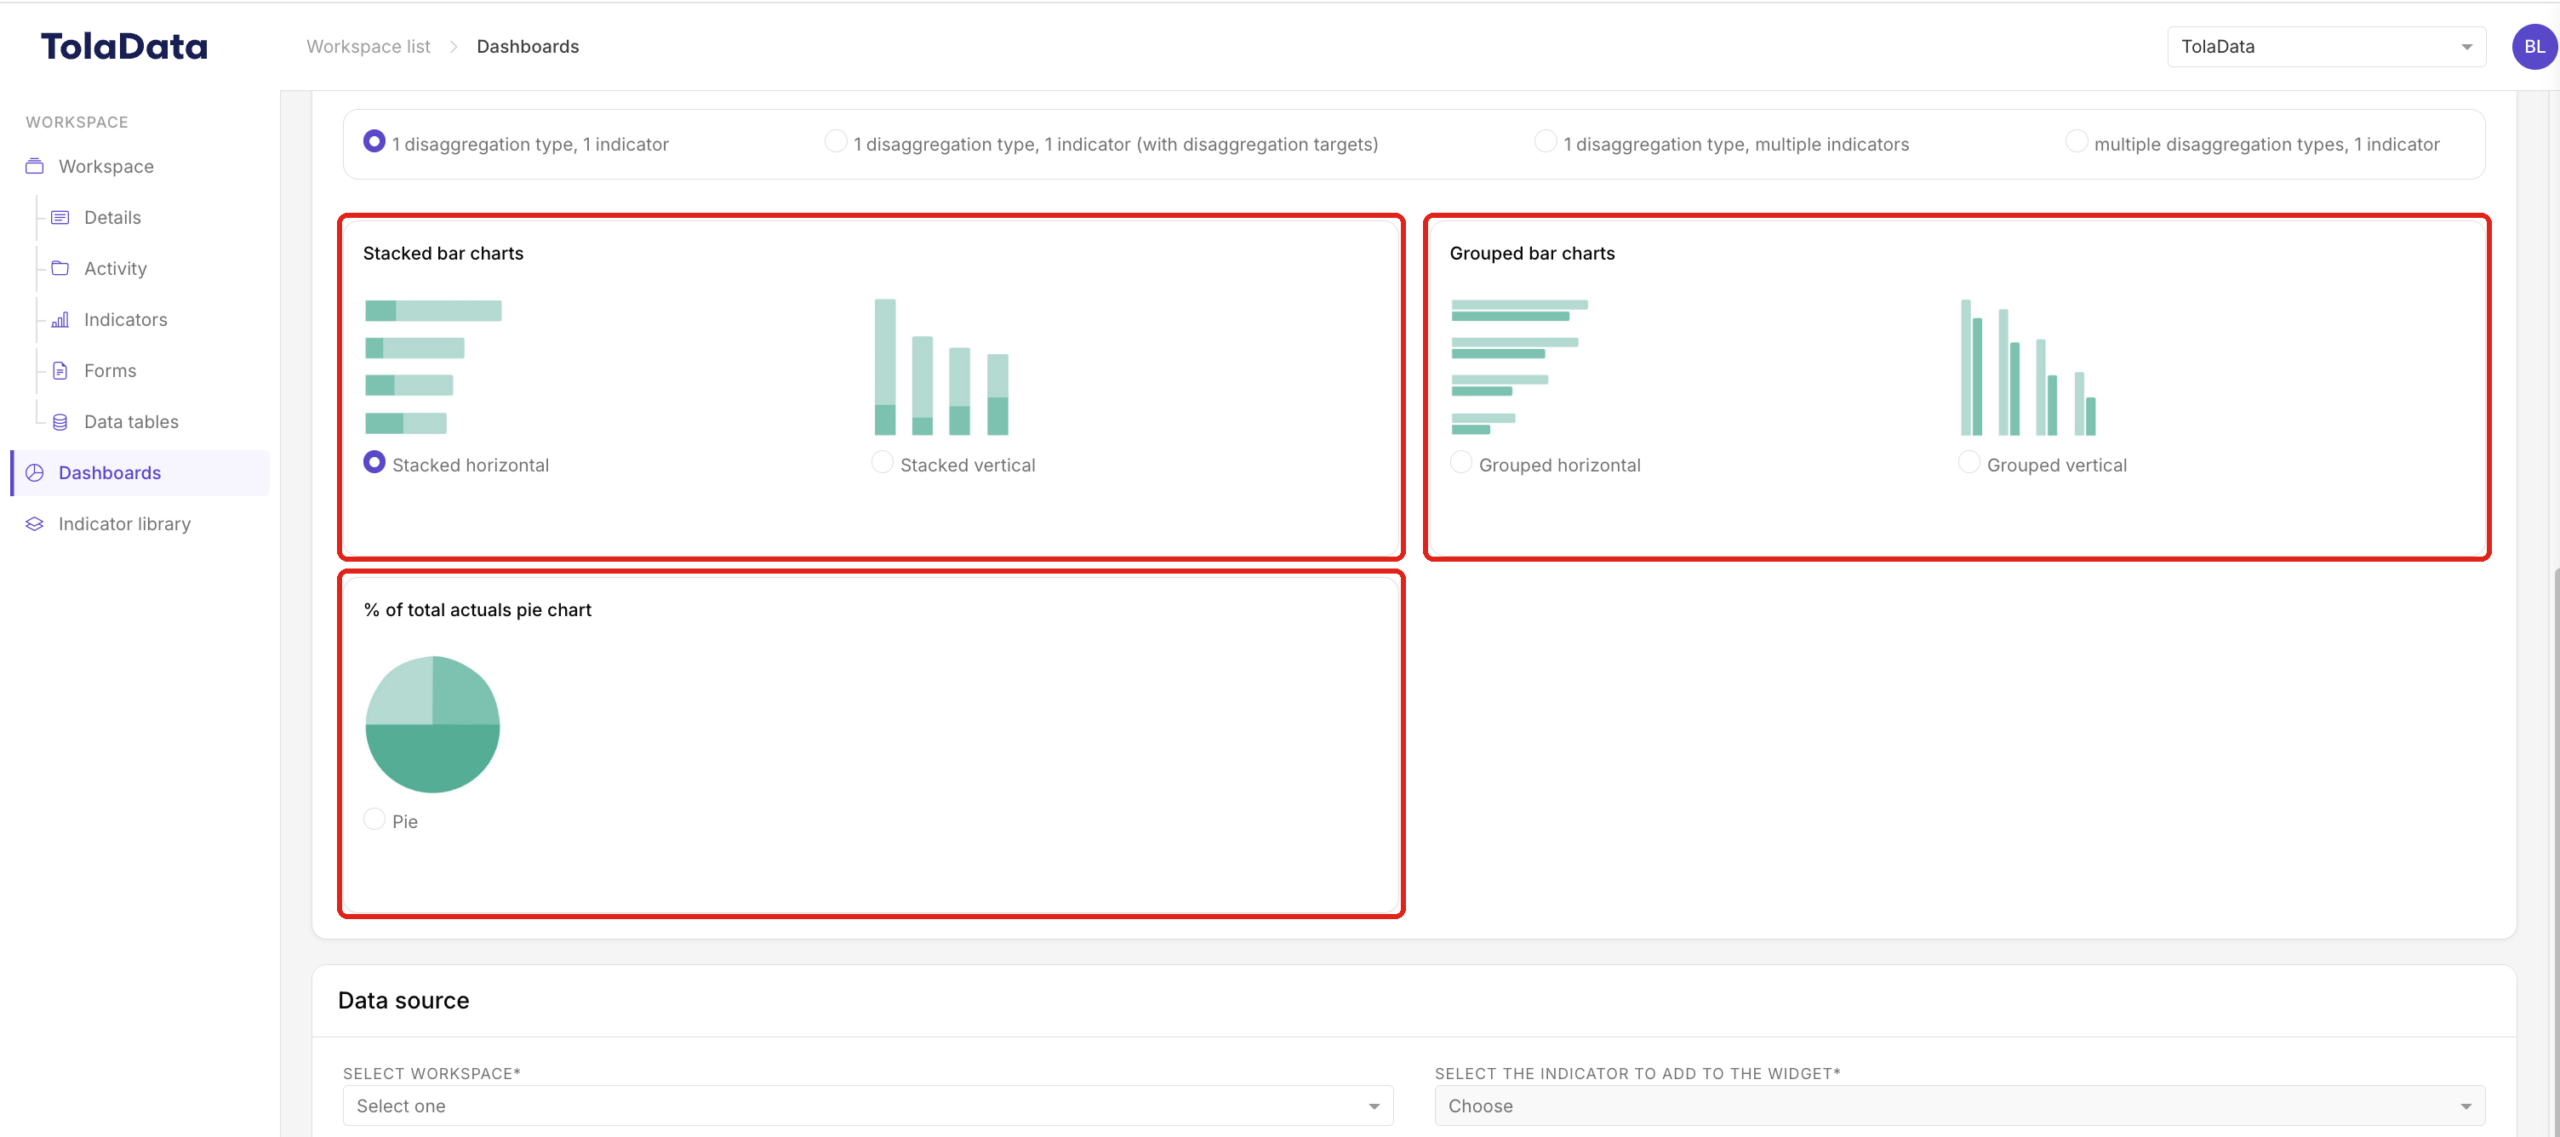
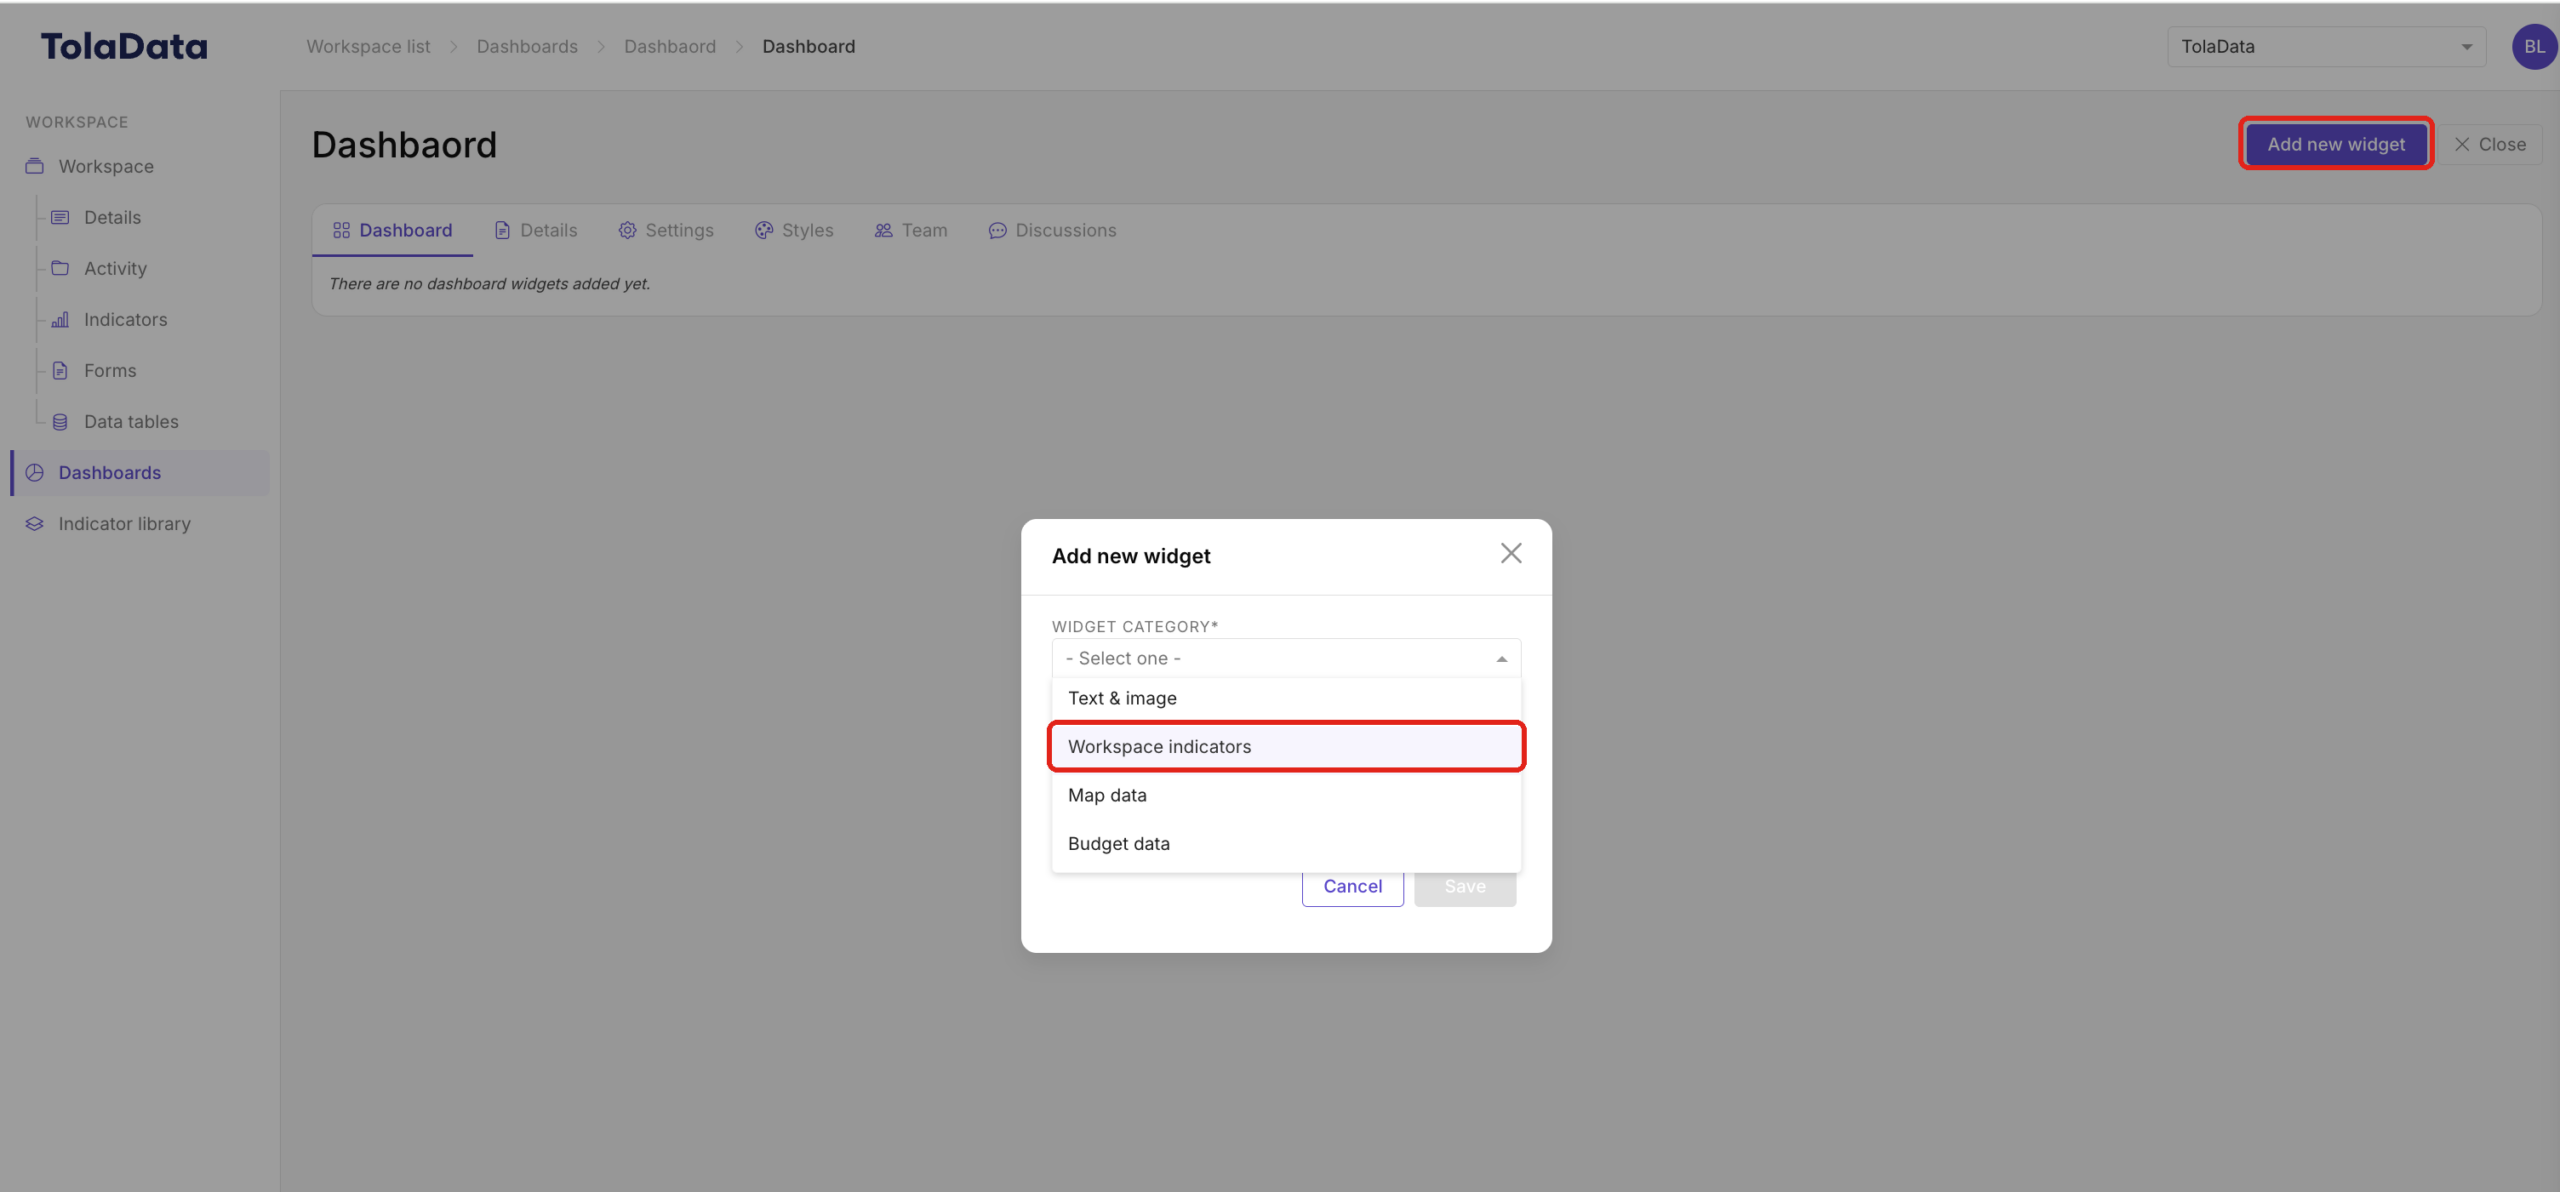
You can visualise disaggregation results on a dashboard using a project indicator widget.
Select the disaggregated results widget type.
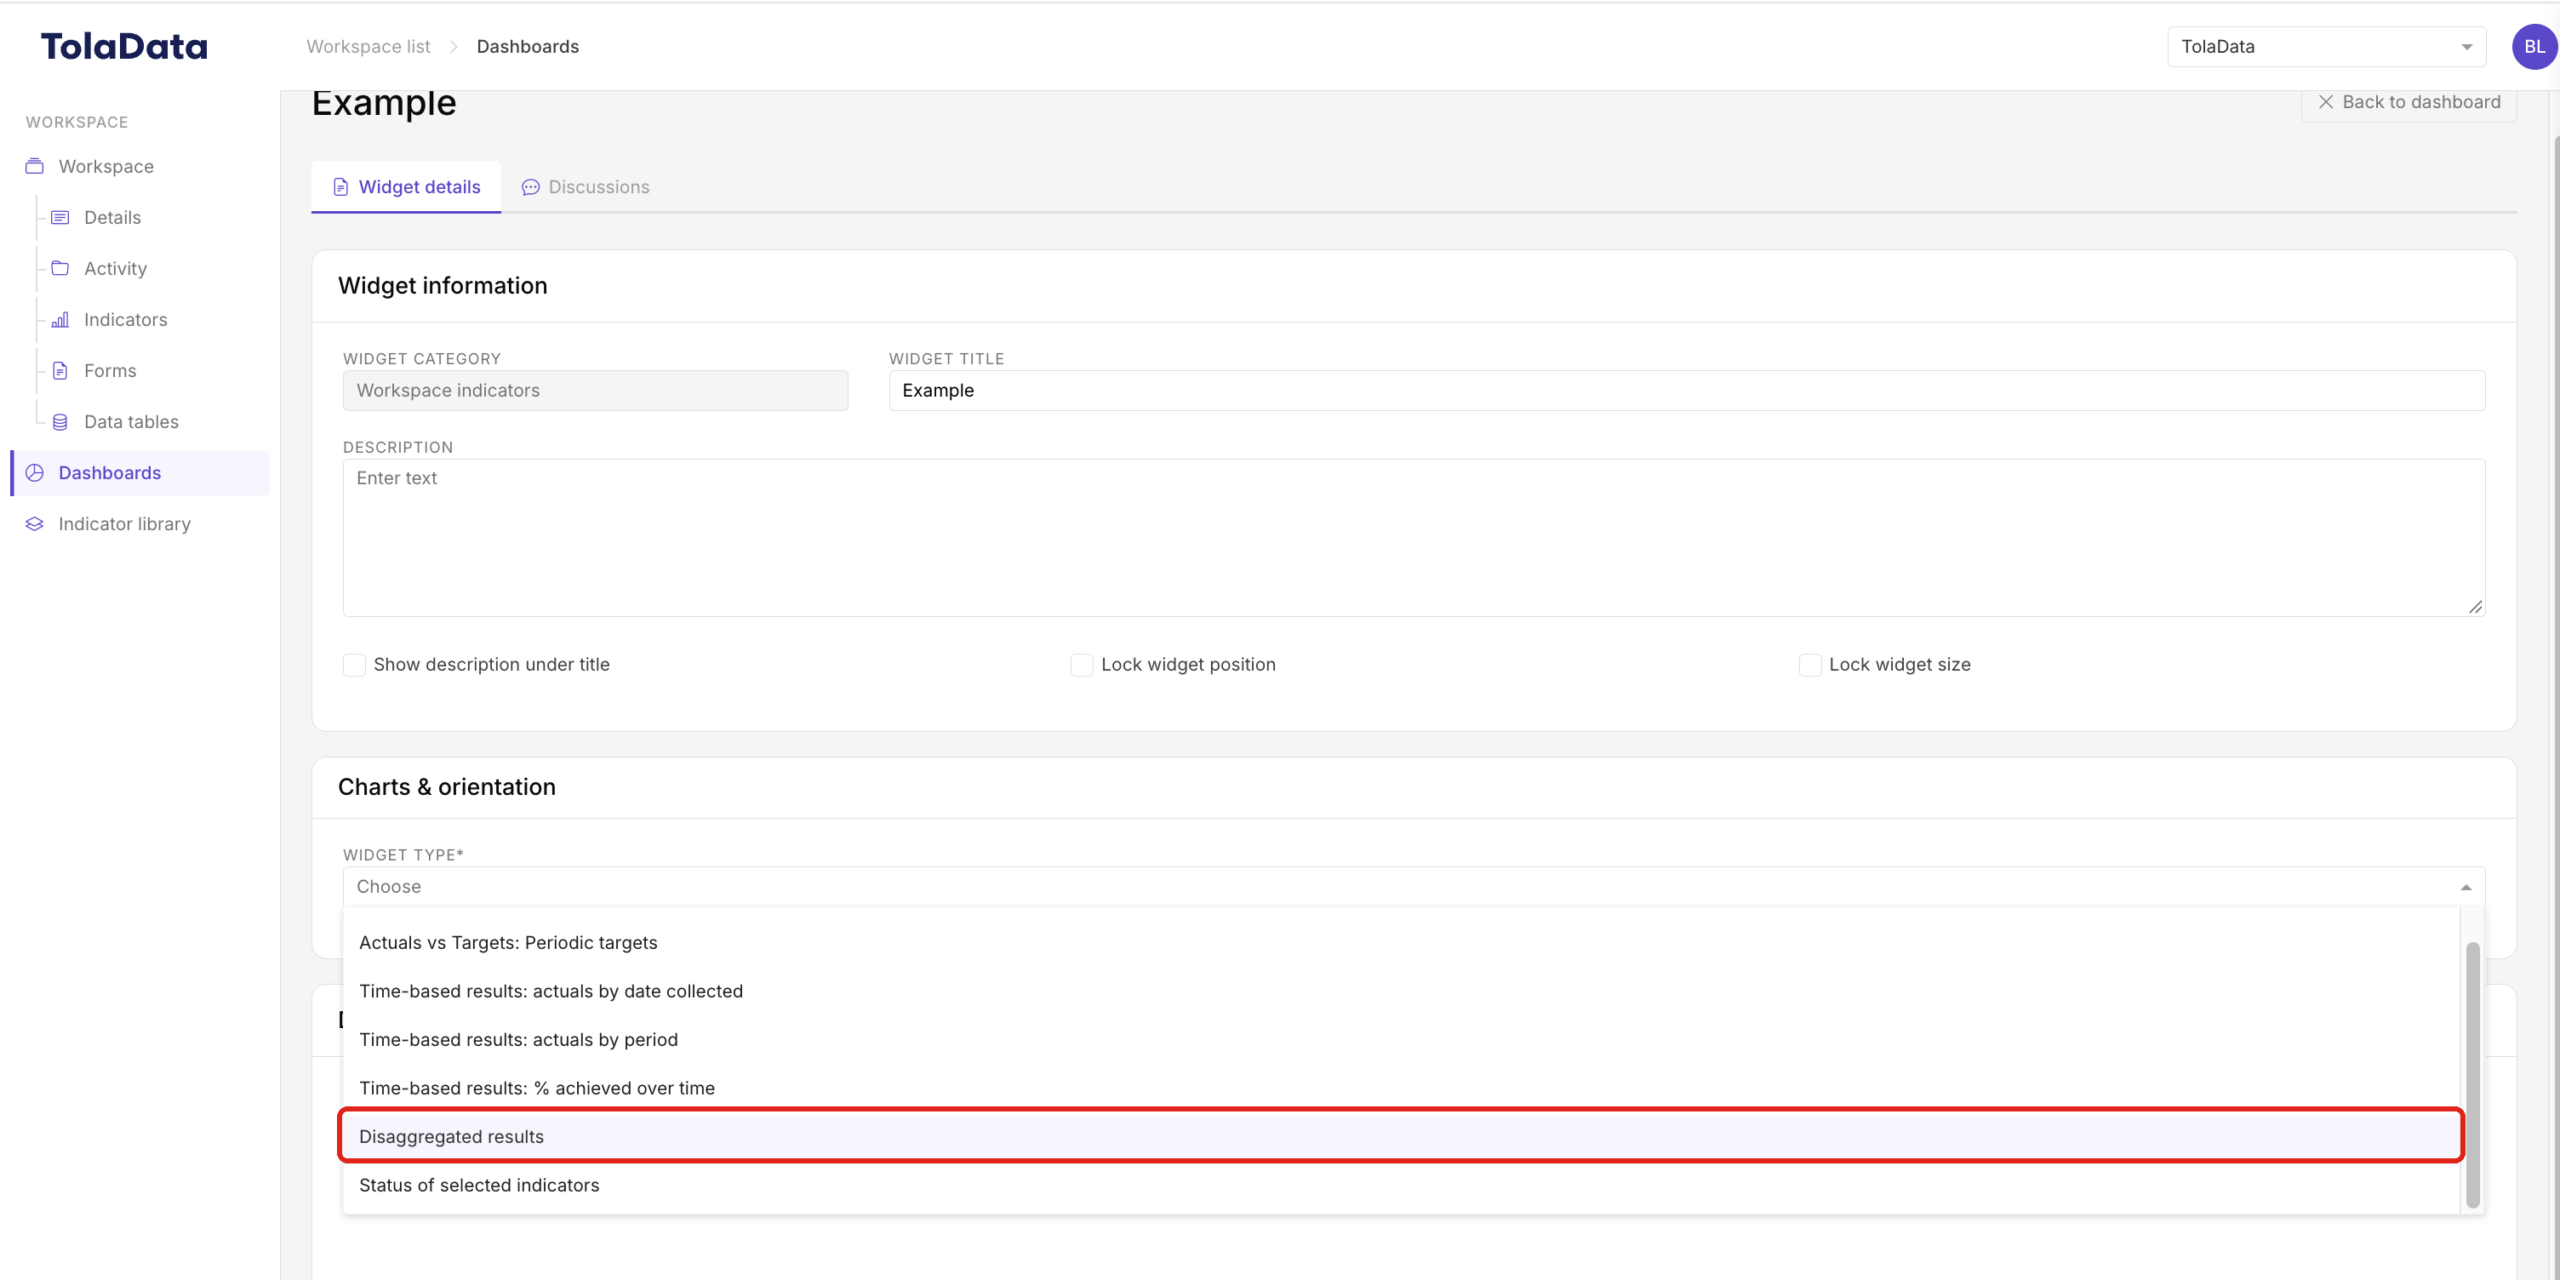
Choose between a stacked bar chart, grouped bar chart, or pie chart to visualize your results. Find out more about widget configuration here.