1. Text and image
Widget name:
Text and image
Description:
Add text and images to your dashboard
Configuration options:
- Text formatting such as Bold, italics, font size, bulleted lists, etc
- URL hyperlinks
- Images to resize according to widget width

2. Project indicators
Widget name:
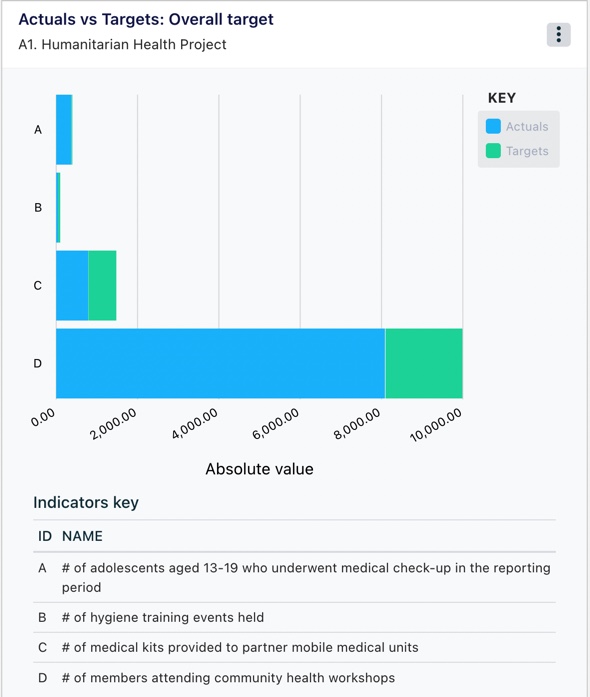
Actuals vs. Targets: Overall target
Widget configuration:
Absolute value charts
Description:
Display multiple indicators from a project in a horizontal or vertical bar graph that shows the total actuals achieved to date against the targets.
Can display both aggregated & non aggregated indicators.
Configuration options:
- Select indicators to display (note that numeric and percentage indicators cannot be displayed in the same chart. After you select the first indicator the list will filter to only indicators of the same type)
- Don’t display target values, so only actuals are displayed in the chart
- Display indicator key underneath the chart so full indicator name can be easily read.
- Filter results by date range so only collected data with a collected date within the date range will be shown
- Show project under title to display the project the indicators have been taken from
Widget name:
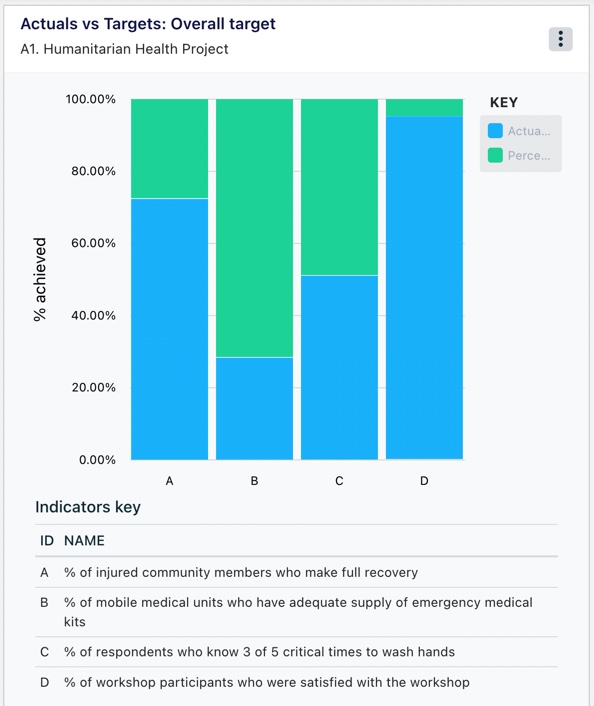
Actuals vs. Targets: Overall target
Widget configuration:
% achieved charts
Description:
Display multiple indicators from a project in a horizontal or vertical bar graph that shows the percentage achieved to date (compared to the target) for each indicator.
Can display both aggregated & non aggregated indicators.
Configuration options:
- Select indicators to display (note that numeric and percentage indicators cannot be displayed in the same chart. After you select the first indicator the list will filter to only indicators of the same type)
- Don’t display target values, so only actuals are displayed in the chart
- Display indicator key underneath the chart so full indicator name can be easily read.
- Filter results by date range so only collected data with a collected date within the date range will be shown
- Show project under title to display the project the indicators have been taken from
Widget name:
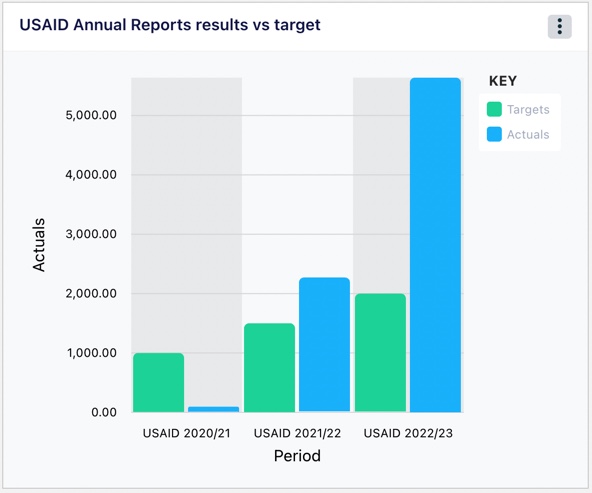
Actuals vs. Targets: Periodic target
Description:
Display an indicator that has a reporting period attached to it in a grouped vertical graph with the actual against the reporting period target.
Can display non aggregated indicators.
Configuration options:
- Select indicator to display
- Show project under title to display the project the indicators have been taken from
Widget name:
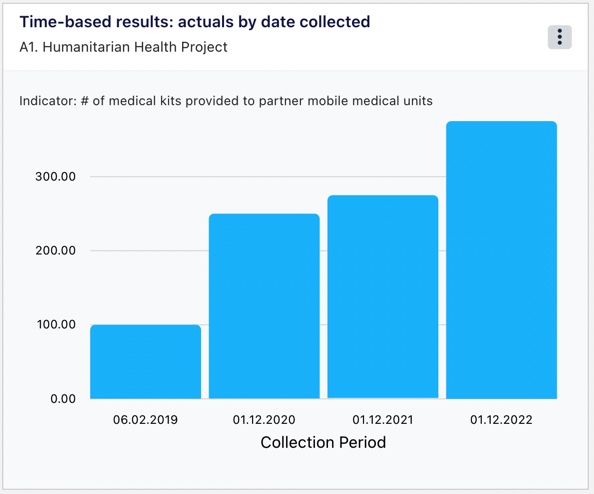
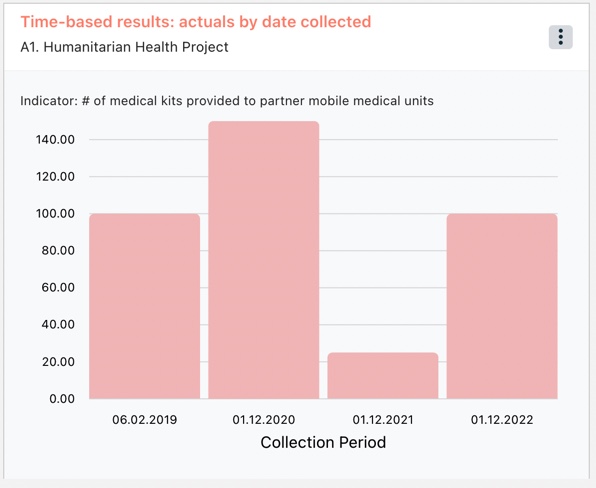
Time-based results: actuals by date collected
Widget configuration:
Cumulative chart
Description:
Display information on one indicator from a project in a vertical bar chart that shows the cumulative actuals at each collection date.
Can display non aggregated indicators.
Configuration options:
- Select an indicator to display
- Filter results by date range so only collected data with a collected date within the date range will be shown
- Show project under title to display the project the indicators have been taken from
Widget name:
Time-based results: actuals by date collected
Widget configuration:
Non-cumulative chart
Description:
Display information on one indicator from a project in a vertical bar chart that shows the actuals at each collection date.
Can display non aggregated indicators.
Configuration options:
- Select an indicator to display
- Filter results by date range so only collected data with a collected date within the date range will be shown
- Show project under title to display the project the indicators have been taken from
Widget name:
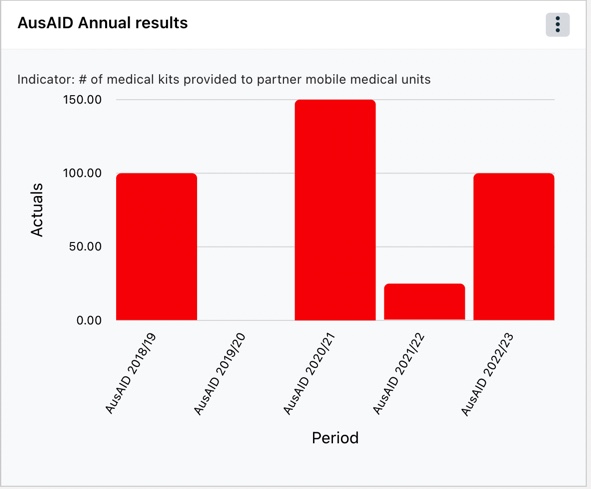
Time-based results: actuals by period
Description:
Display information on one indicator from a project in a vertical bar chart that shows the actuals by reporting period.
Can display both aggregated & non aggregated indicators.
Configuration options:
- Select an indicator to display
- Show project under title to display the project the indicators have been taken from
Widget name:
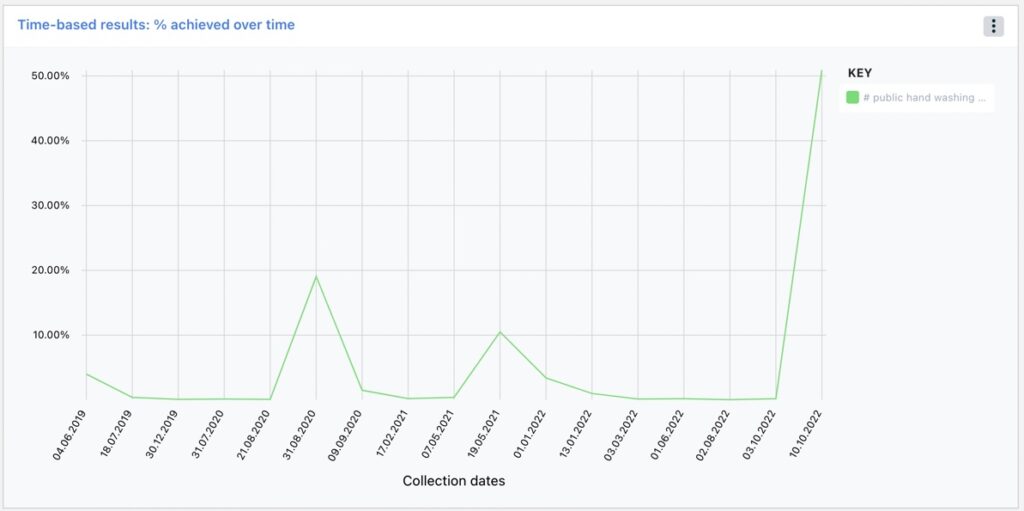
Time-based results: % achieved over time
Description:
Display multiple indicators from a project in a line graph that shows the percentage achieved over time.
Can display non aggregated indicators.
Configuration options:
- Select indicators to display
- Filter results by date range so only collected data with a collected date within the date range will be shown
- Show project under title to display the project the indicators have been taken from
Widget name:
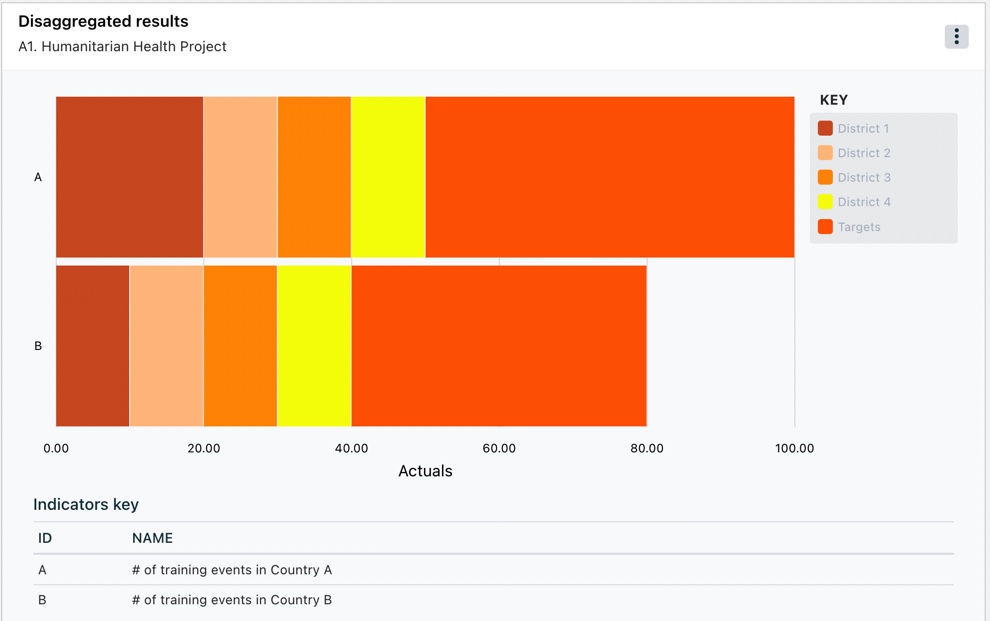
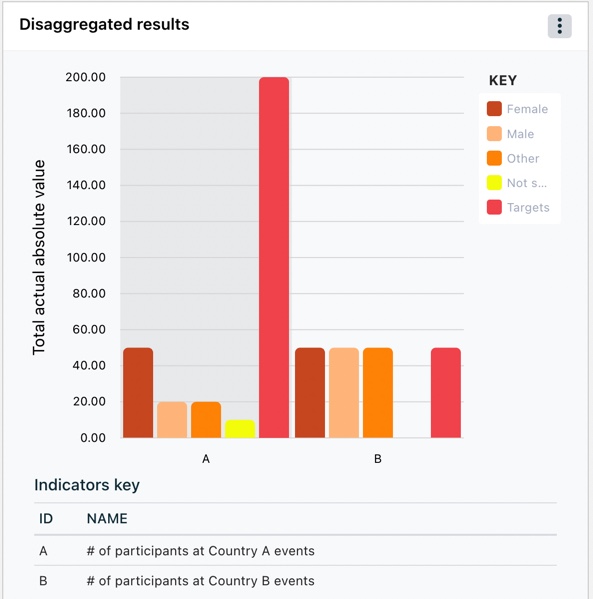
Disaggregated results
Widget Configuration:
Stacked bar charts
Description:
Display information on multiple indicators from a project in a horizontal or vertical bar chart with the results split by a selected disaggregation type or display multiple disaggregations from one indicator.
Can display both aggregated & non aggregated indicators.
Configuration options:
- Select indicators to display (note that numeric and percentage indicators cannot be displayed in the same chart. After you select the first indicator the list will filter to only indicators of the same type)
- Select disaggregation type (note that you can only choose disaggregation types used on the indicator selected)
- Don’t display target values, so only actuals are displayed in the chart
- Display indicator key underneath the chart so the full indicator name can be easily read.
- Filter results by date range so only collected data with a collected date within the date range will be shown
- Show project under title to display the project the indicators have been taken from
Widget name:
Disaggregated results
Widget Configuration:
Grouped bar charts
Description:
Display information on multiple indicators from a project in a grouped horizontal or vertical bar chart that with the results split by a selected disaggregation type or display multiple disaggregations from one indicator.
Can display both aggregated & non aggregated indicators. .
Configuration options:
- Select indicators to display (note that numeric and percentage indicators cannot be displayed in the same chart. After you select the first indicator the list will filter to only indicators of the same type)
- Select disaggregation type (note that you can only choose disaggregation types used on the indicator selected)
- Don’t display target values, so only actuals are displayed in the chart
- Display indicator key underneath the chart so the full indicator name can be easily read.
- Filter results by date range so only collected data with a collected date within the date range will be shown
- Show project under title to display the project the indicators have been taken from
Widget name:
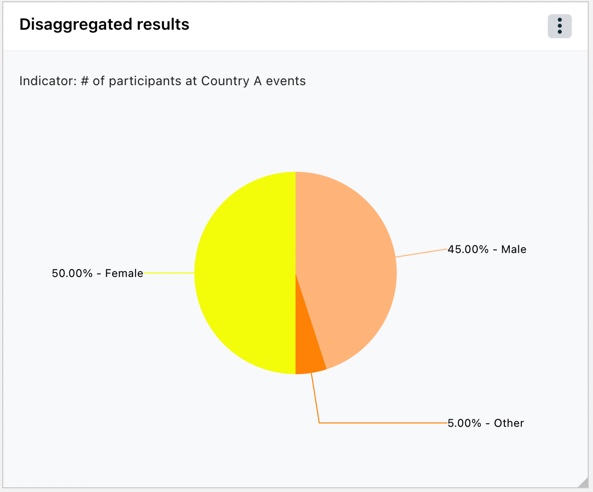
Disaggregated results
Widget Configuration:
% of total actuals pie chart
Description:
Display information on one indicator and one disaggregation from a project in a pie chart that shows the disaggregated results for the indicator as a percentage of the total actuals.
Can display both aggregated & non aggregated indicators.
Configuration options:
- Select indicator to display
- Select disaggregation type (note that you can only choose disaggregation types used on the indicator selected)
- Filter results by date range so only collected data with a collected date within the date range will be shown
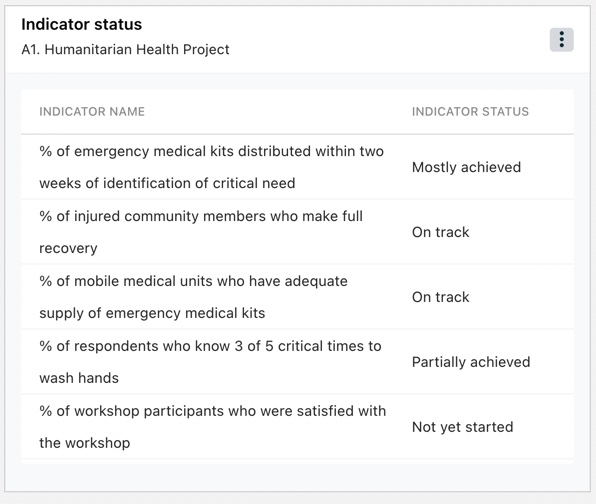
Widget name:
Status of selected indicators
Description:
Display the status of selected qualitative or quantitative indicators from multiple projects
Configuration options:
- Select the indicators to display
- Show project in widget to display the project name next to the indicator
- Show project under title to display the project the indicators have been taken from under the widget title
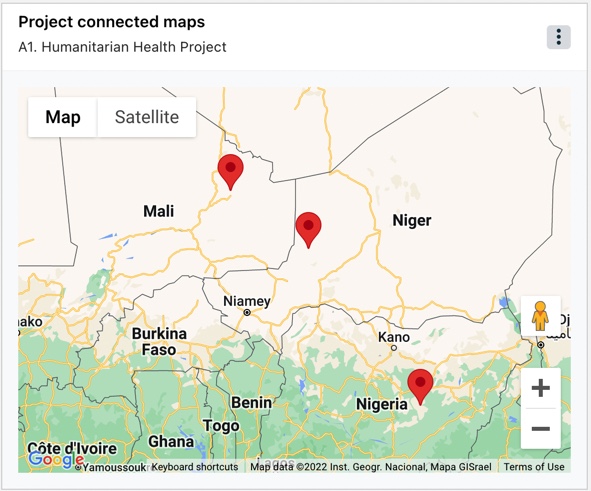
Widget name:
Map data
Description:
Display sites linked to your project in a map
Configuration options:
- Select projects to display (note that sites must be linked at the project level to display in the map chart)
3. Budget Data
Widget name:
Budget data
Widget configuration:
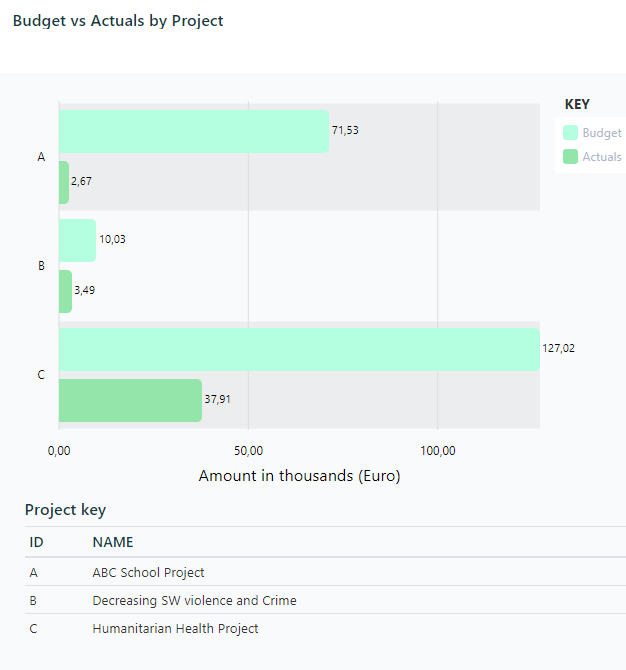
Budget vs Actuals by Project
Description:
Display total spend vs budget of selected projects in a horizontal bar graph
Configuration options:
- Select projects to display
- Choose to show values in hundreds, thousands, hundred thousands, or millions. This will determine the scale of the x-axis
- Display project key underneath the chart so the full project name can be easily read.
Widget name:
Budget data
Widget configuration:
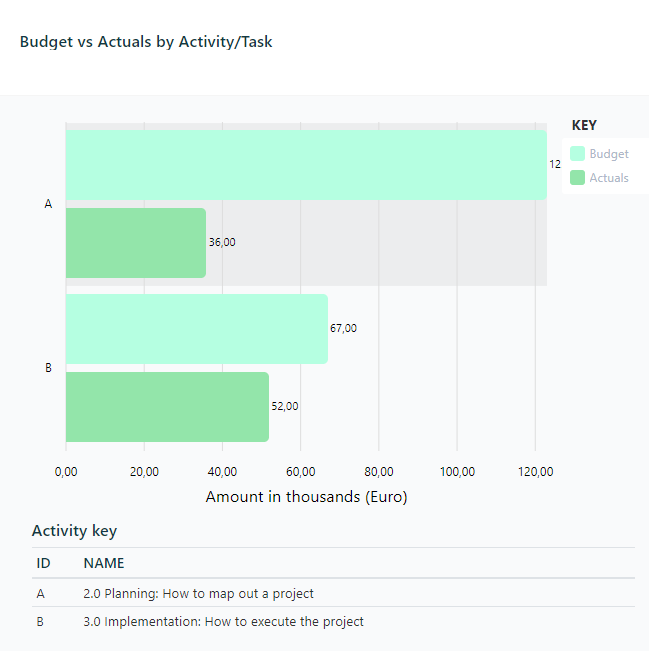
Budget vs Actuals by Activity/Task
Description:
Display budget data from multiple activities/tasks in a stacked horizontal bar graph that shows the total actuals spent to date against the overall allocated budget for each activity
Configuration options:
- Select activities of a project to display
- Choose to show values in hundreds, thousands, hundred thousands, or millions. This will determine the scale of the x-axis
- Display activity key underneath the chart so the full activity name can be easily read.
Widget Types and Indicator Formatting
| Chart | Can display numeric indicators | Can display % indicators | Can mix numeric and % indicators in one chart | Can select two or more indicators in one chart | Notes |
| Actuals vs. Targets: Overall target – Absolute values chart | ✔️ | ✔️ | ✔️ | ||
| Actuals vs. Targets: Overall target – % achieved charts | ✔️ | ✔️ | ✔️ | ✔️ | |
| Actuals vs. Targets: Periodic target | ✔️ | ✔️ | |||
| Time-based results: actuals by period | ✔️ | ✔️ | |||
| Time-based results: % achieved over time | ✔️ | ✔️ | ✔️ | ||
| Time-based results: actuals by date collected – Non-cumulative chart | ✔️ | ✔️ | |||
| Time-based results: actuals by date collected – Cumulative chart | ✔️ | ✔️ | |||
| Disaggregated results – Stacked bar charts | ✔️ | ✔️ | ✔️ | You cannot compare non-summable indicators in this chart such as rate values. | |
| Disaggregated results – Grouped bar charts | ✔️ | ✔️ | You cannot compare non-summable indicators in this chart such as rate values. | ||
| Disaggregated results – % of total actuals pie chart | ✔️ | You can only select a numeric indicator with a total actuals formula of sum or last collection date for this chart type. |