Configurable Dashboards for easy reporting and collaboration
View and share your results in real-time and ensure transparency, accountability and data driven decision making
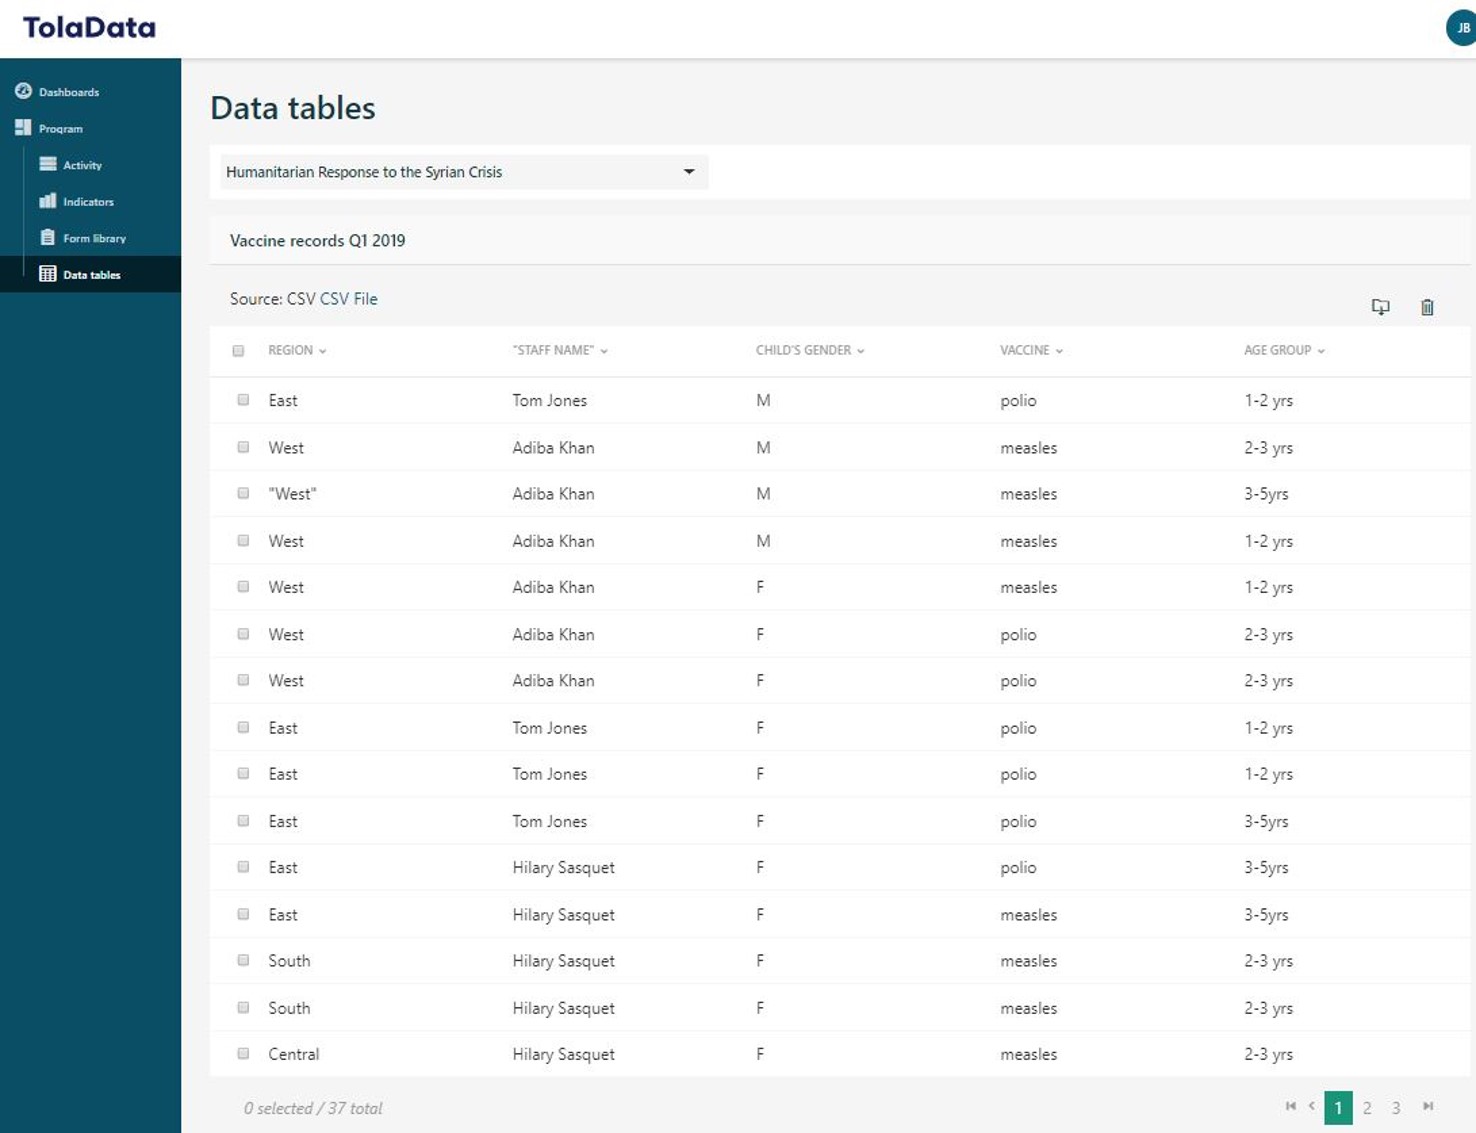
No more diving into the data jungle to screen out what you need from endless spreadsheets and files every time you need to prepare a report for your stakeholders. It’s time to replace this manual process with a digital solution that stores all your data in one platform for easy access and analysis and allows you to visualize and share your most up-to-date progress through a configurable dashboard.
Meet the growing demand for transparency
With the growing demand of donors for transparent and evidence-based reporting, the traditional practice of sharing results at the very end of the project cycle has become inadequate.
We built TolaData to enable you to track and measure the progress of your interventions continuously and consistently. Plus, visualize and share your most up-to-date results via dashboards with all your stakeholders and donors at every stage of the project cycle.
Open space for collaboration
Give stakeholders direct access to your project information and open space for collaboration through visual dashboards. Use eye-catching charts, graphs, narratives and images to enhance the impact of your project reporting.
Stay on top of things in real-time as the dashboard updates itself whenever new data comes in to help you ensure transparency and accountability, at all times.
Say goodbye to complex reporting
How many times have you had to wait for days or months to receive the latest updates via email? Then comes your challenge of filtering through all that data in various formats and crunching numbers manually to pick information to highlight in your report for your partners and stakeholders.
It doesn’t have to be this way, not when TolaData streamlines the process of pulling together data for reporting in a cleaner and faster way.
Reduce the risk of human error
Reduce the risk of human error
Do you manually input your collected data into several Excel spreadsheets and aggregate them over many reporting levels to produce a final report? Does this usually happen weeks or months after the data was collected?
Not only is this time-consuming, but you also run the risk of making mistakes from extensive copying, pasting and merging data from tens, or even hundreds of Excel files. We automated our data import precisely so you can avoid the hassle.
Stakeholders and partners stay up to date
No need to work for hours to put information together for your stakeholders when it’s time for reporting. Just send them a quick URL link to your dashboard and enable them to review your most up-to-date progress with a click of a button.