Indicators are part and parcel of any monitoring and evaluation (M&E) framework. Creating good indicators to ensure that your project achieves its desired outcome, however, is a whole other topic in itself — one we’re about to tackle in this blog post. Stay with us as we show you how you can set up indicators the right way.
What are indicators? Why are they important?
Indicators are specific markers that measure the progress your project is making towards reaching its goals. They can be quantitative or qualitative.
Quantitative indicators
reflect the output, so you know whether your activities are going according to plan. They’re what we call the hard facts and are usually expressed in numerical terms such as whole numbers, percentages, ratios and fractions. Examples of quantitative indicators include the per capita income, life expectancy, and a number of schools per square kilometre.
Qualitative indicators
reflect the outcome, so you know whether the work you do is resulting in the change you’d like to achieve, and are usually expressed in descriptive terms, which can include statements of opinion and fact. Examples of qualitative indicators include participation in a fundraiser, level of satisfaction among employees, and ease of access to a school.
Before starting any project, it is important that you describe your indicators as clearly and precisely as possible, in order to know what you’re measuring. The changes measured by your indicators should tell you whether your project is making any progress.
Let’s begin with the basics.
Indicators comprise a baseline and a target, both of which when compared against each other, measure change. Here’s how we define them.
Baseline: a measure used to benchmark the current state of an indicator so that the recorded results can be appropriately calculated
Target: the improvement or achievement expected to take place while the project is being implemented
Make your indicators SMART
At TolaData, we’re big fans of ‘SMART’ — an acronym commonly used in M&E — to guide us in creating indicators.
Specific
Specific indicators should include detailed parameters regarding the desired quantity, quality, and location of your results.
Measurable
Measurable indicators can be assessed objectively and independently. They should produce the same results no matter who’s performing the assessment.
Achievable
Are your indicators realistic, given the project’s time, cost, and scope? That’s how you know whether they are achievable.
Relevant
Indicators must accurately measure the change the project aspires to bring about.
Time-bound
Each indicator should identify a specific time and date by when you’d like to achieve a certain result. Make sure it’s realistic.
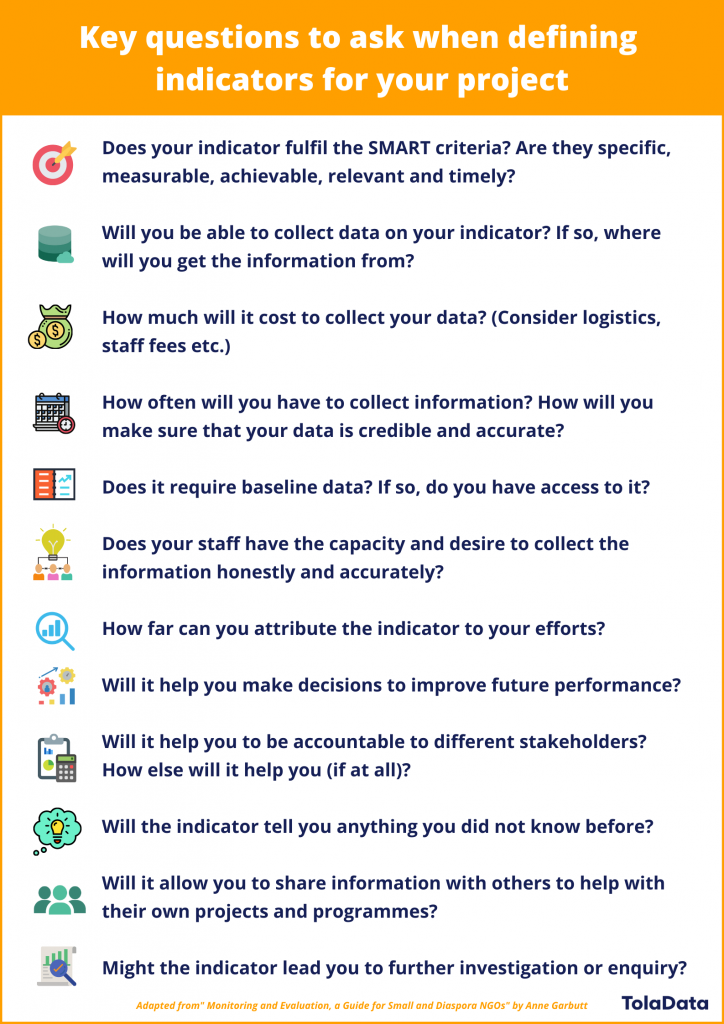
Asking these key questions can help you define good indicators
Locating indicators on TolaData
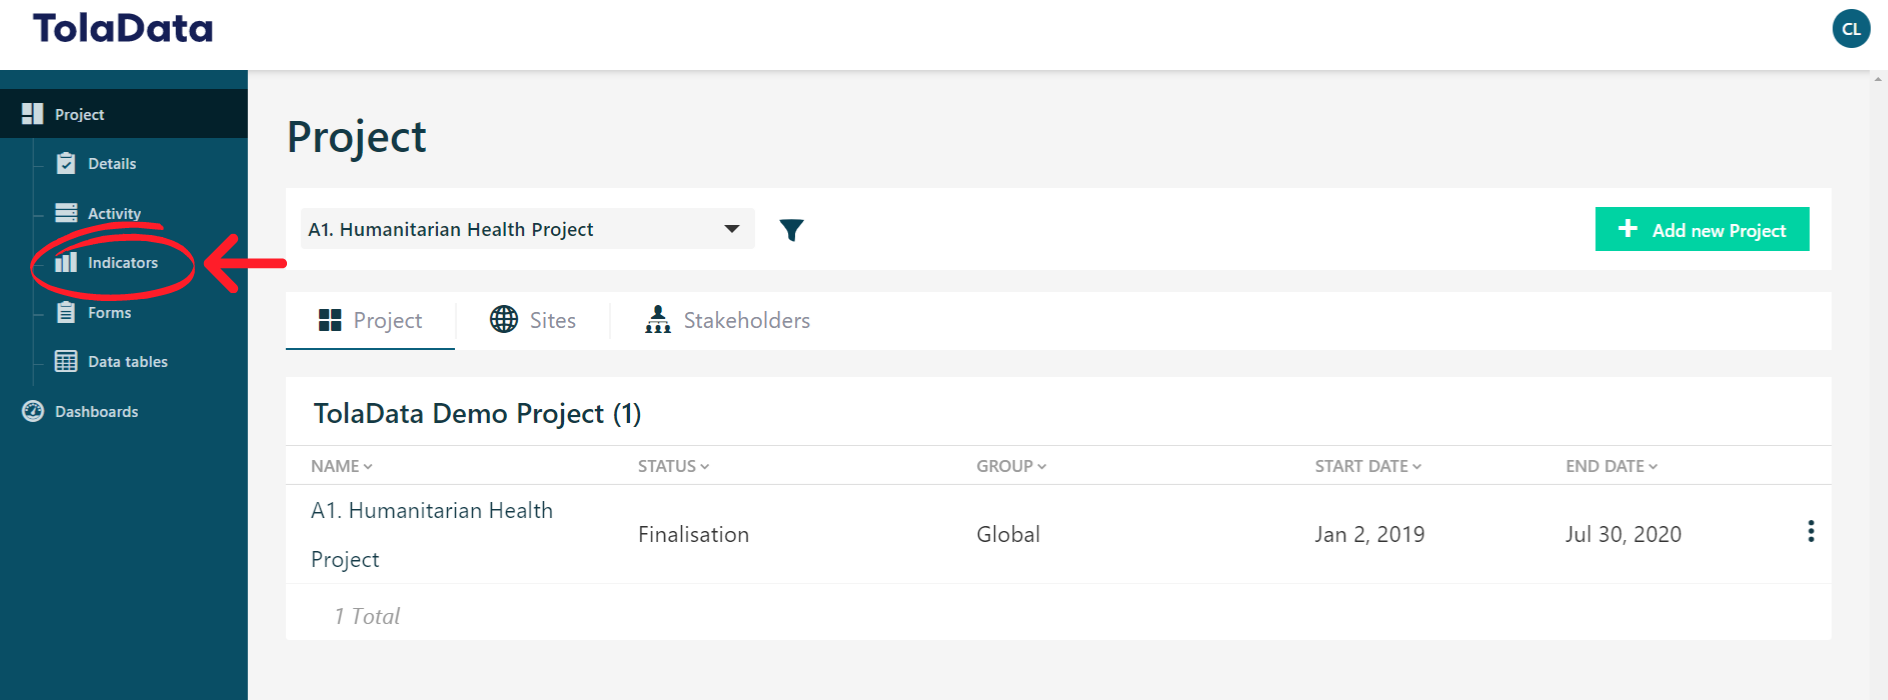
When you log into your TolaData account, look for the ‘Indicators’ tab on the left.
Click on it and the corresponding screen should appear.
Now, get ready to add your indicators!
Adding indicators on TolaData
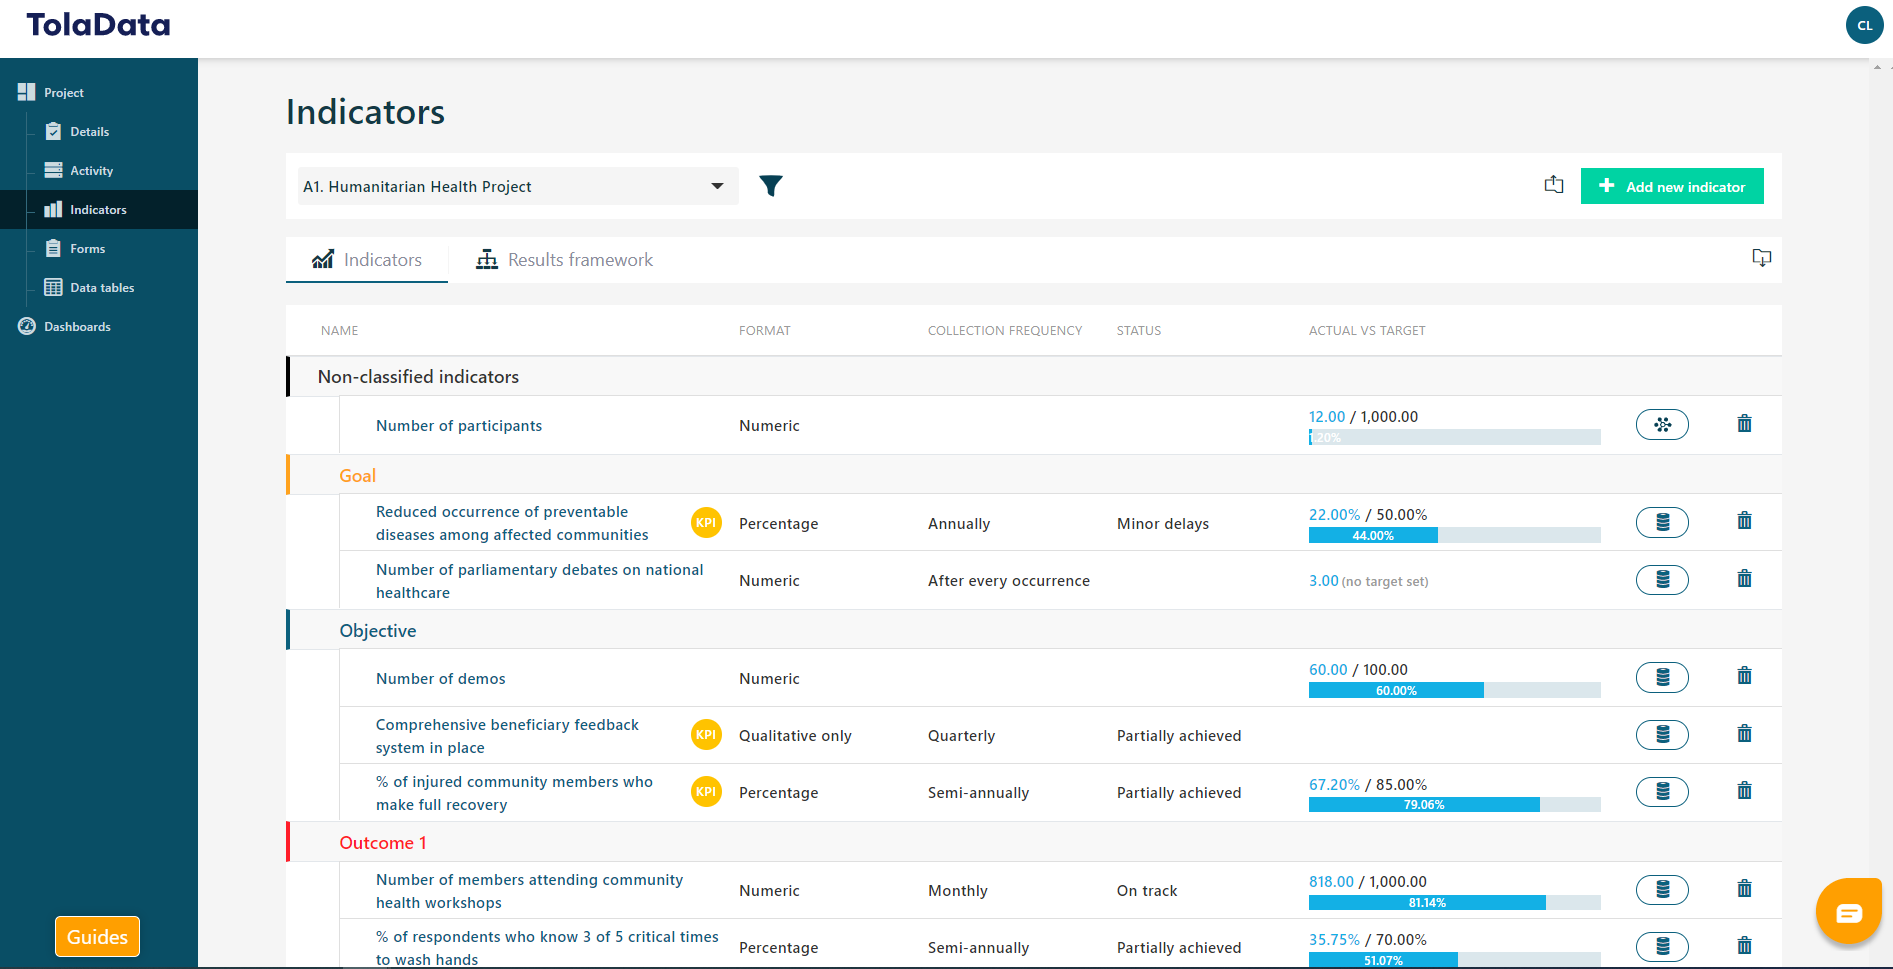
You can add your indicators under one of the previously created Results Framework levels, or leave them unassigned, you can always change that later.
To add an indicator, click on ‘Add new indicator’ tab on the top right hand corner and proceed to filling out the indicator name, indicator type, your preferred direction, life of program (LOP) target figure and baseline figure, then hit ‘Save.’
Your indicator will appear under the ‘Indicators’ section and you can drag it to place it under the relevant ‘Outcomes’ or ‘Outputs.’
How many indicators should I add?
When selecting indicators, take note of the following guidelines to ensure you select indicators which don’t just sound appealing but which truly fit for purpose:
Relevance: Ensure that your theory of change is considered in order to select the most appropriate indicator
Measureable: Develop an analysis plan to help you think through what data you need in order to measure your indicator
Cost-effective: Explore a mix of data collection strategies and sources in order to estimate the “cost” associated to collecting data
What about targets?
Once you’ve selected your indicators, you are now ready to define it for your team to use. Start by adding targets or your unit of measure, which could be a currency, or a measure of weight or area like tons or acres.
Or frequency?
How often will you be reporting results for this indicator? Monthly? Quarterly? That describes its frequency.
You can add your baseline value and ‘life of program’ or LOP target value for your indicator. LOP refers to the ultimate target you intend to achieve for your indicator by the end of the project.
Congratulations! Now you’re on your way to better monitoring and evaluation for project success.
EST. 2018
About TolaData
TolaData is a leading digital platform for Monitoring & Evaluation management, created by passionate development professionals and digital innovators to transform the way the not-for-profit sector monitors and evaluates projects.
The TolaBrief Newsletter
A monthly round-up of news and useful links on the digitisation of the sustainable development sector, from the team at TolaData