TolaData automatically analyses how aggregated indicators, and their contributing indicators, develop over time. This supports programme and portfolio management.
Time-based results
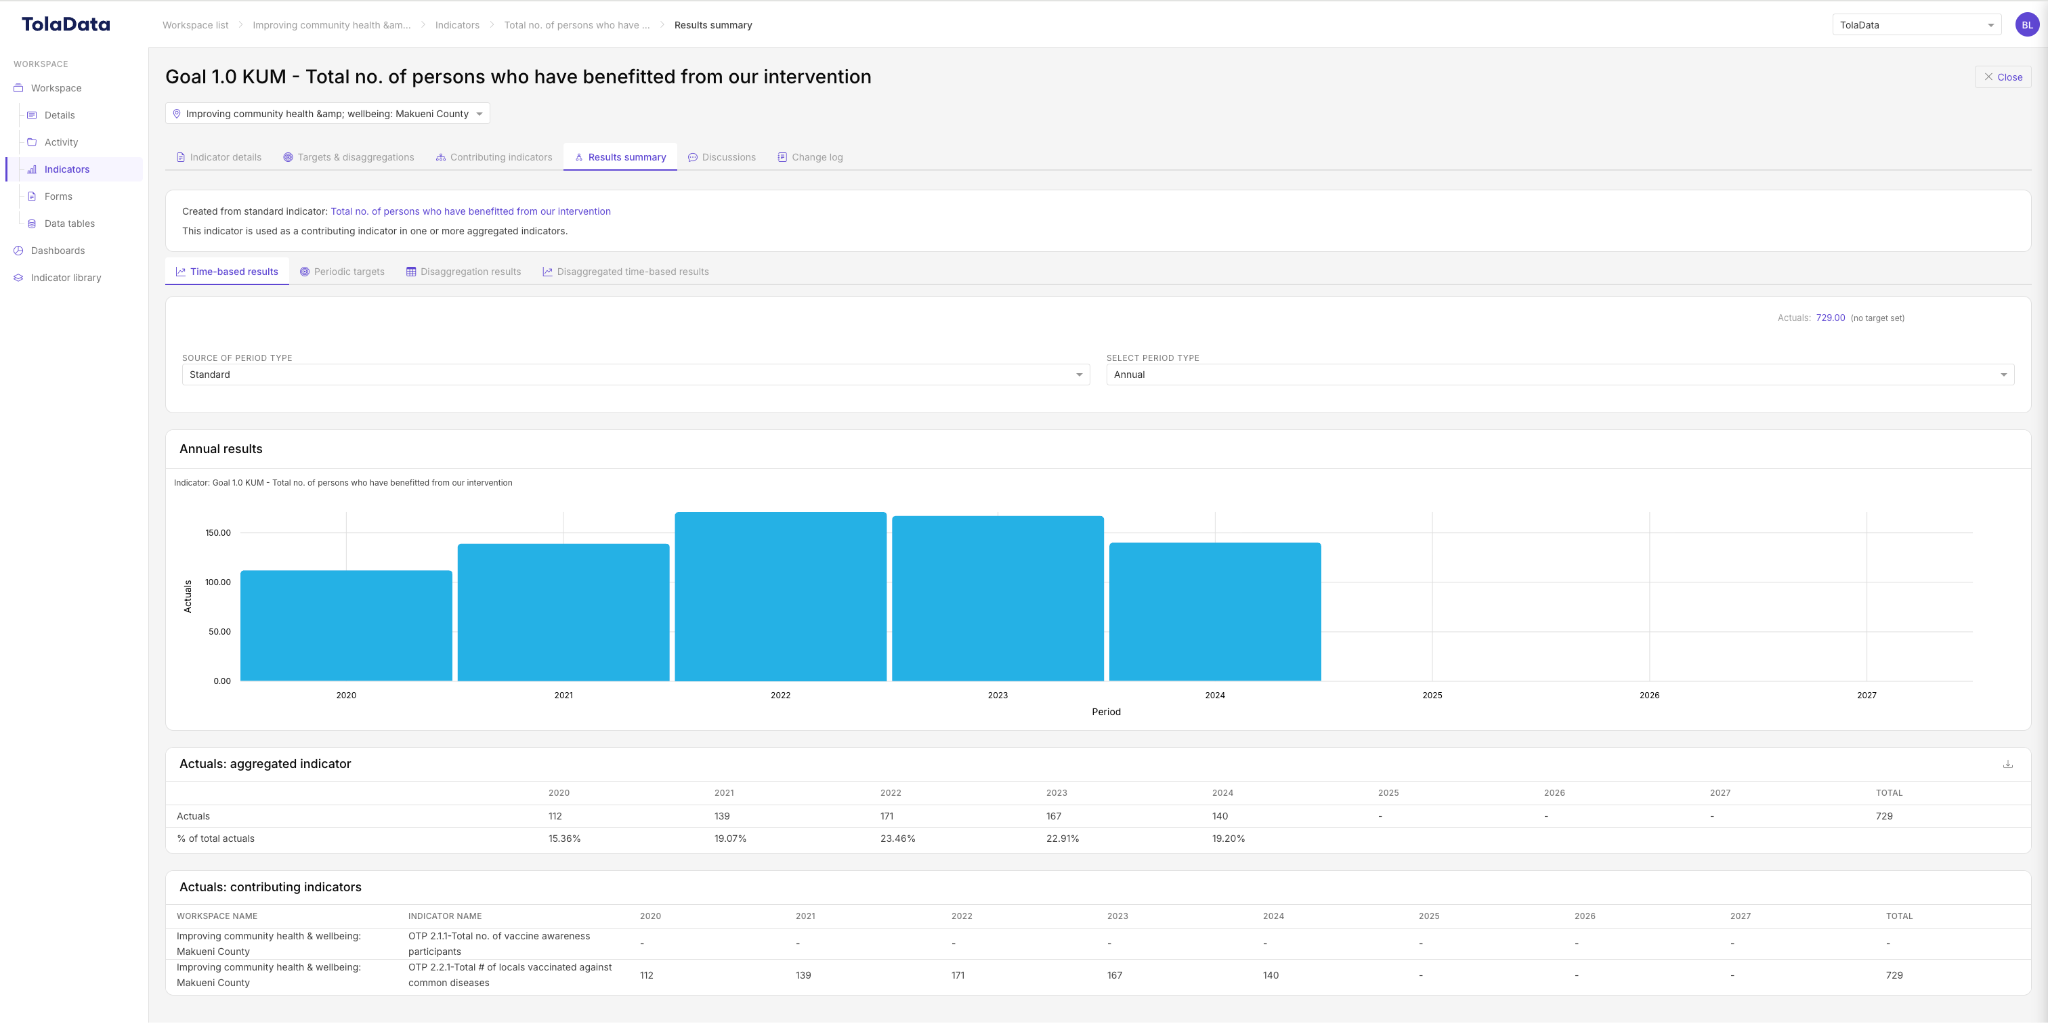
Open an aggregated indicator and go to its Results summary. Select Time-based results to see results by time period. You can show results by standard periods (for example annual or quarterly) or by the custom reporting periods you have created, such as a donor’s reporting periods.
Disaggregated time-based results
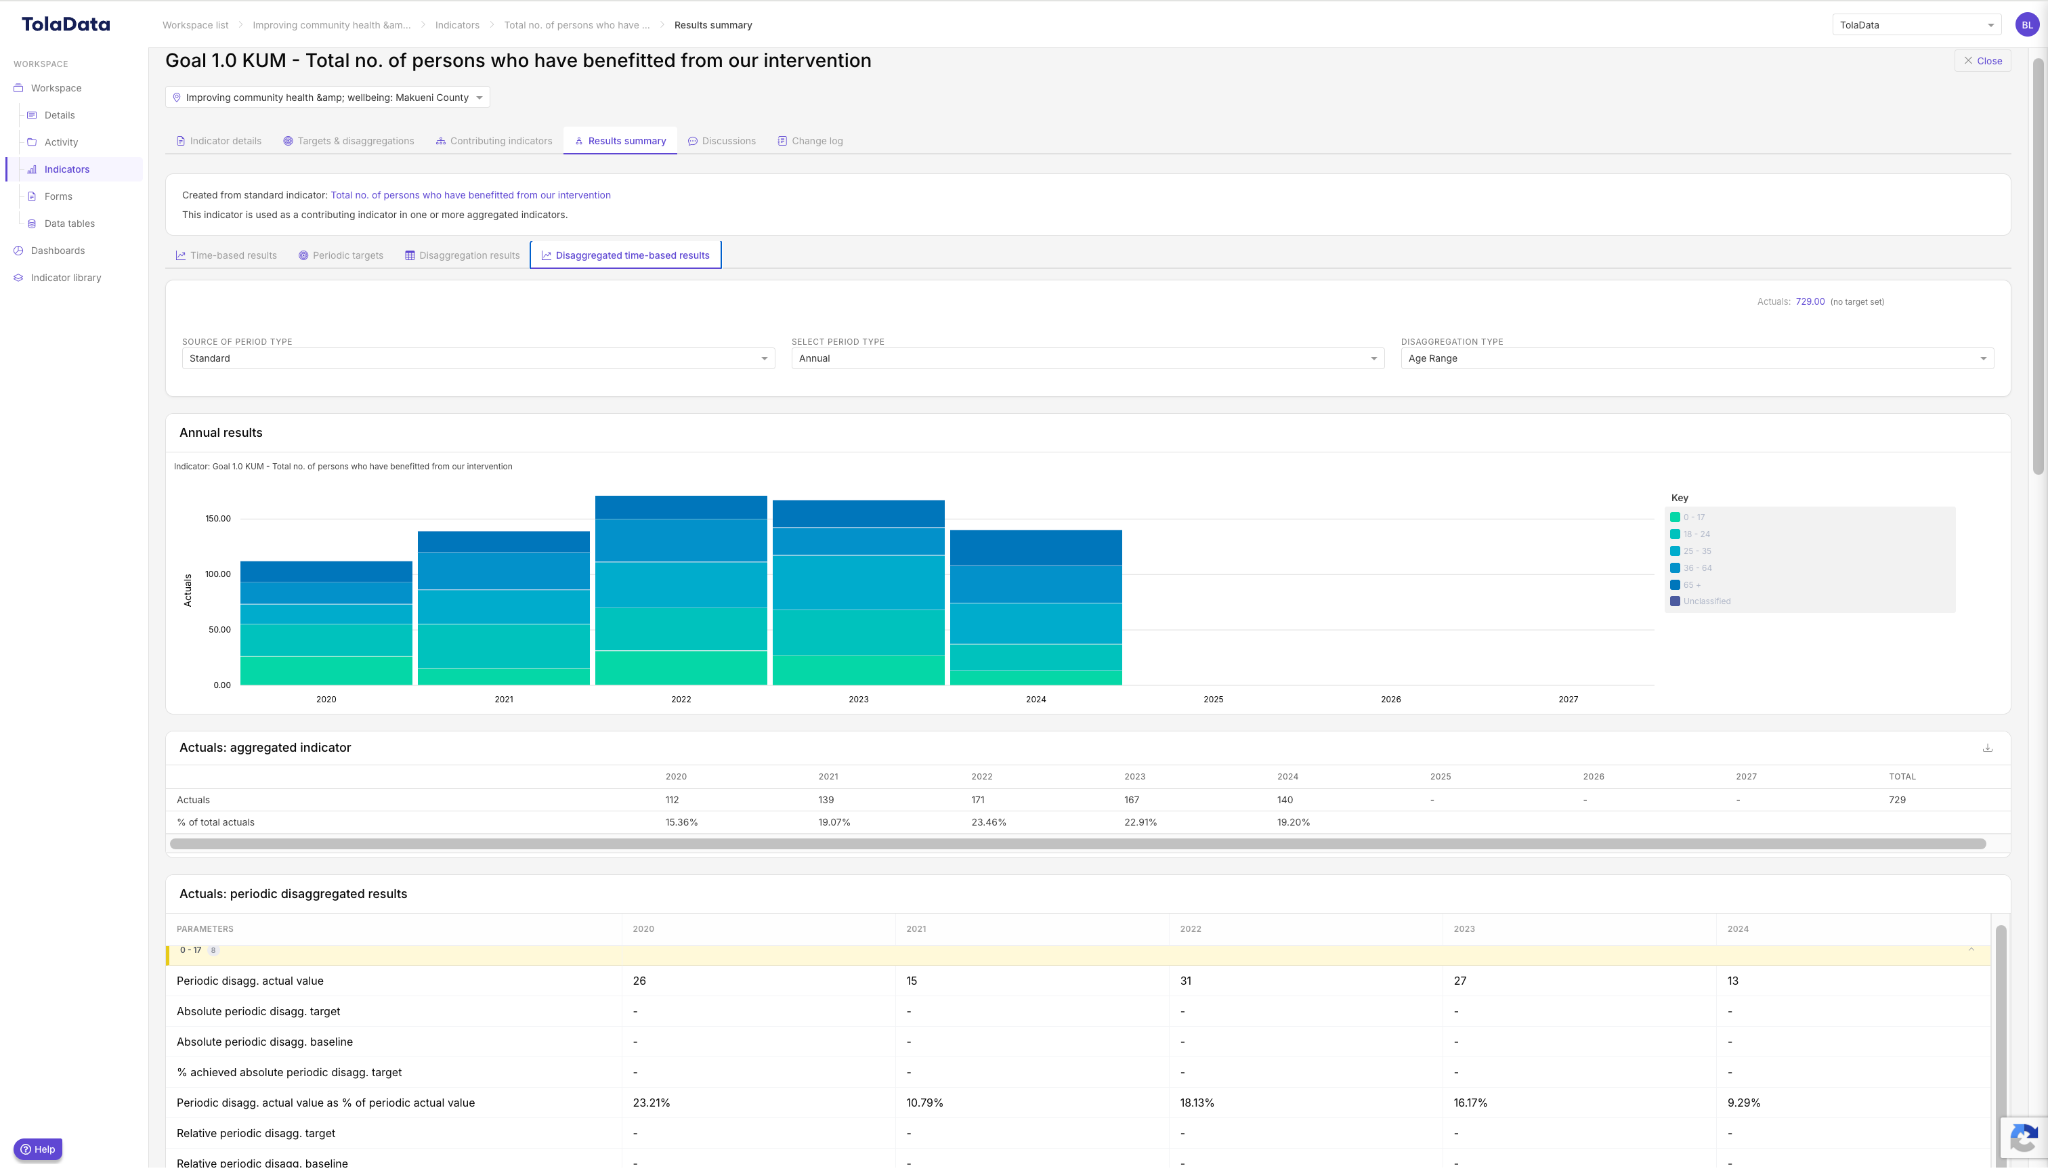
Select Disaggregated time-based results to track disaggregations such as gender or age group over time across the entire programme, portfolio or organisation.
Aggregation formulas
When aggregating results you can define formulas using sum, subtraction, multiplication, average and division. Contributing results can also be weighted or adjusted.